


Introduction
Mortality biomarkers are of great clinical and research interest. General clinical applications include identifying high-risk patient groups, prognosticating for individual patients, and helping healthcare providers decide among treatment options [1]. Examples of very well-studied mortality biomarkers include blood pressure, cholesterol, and waist circumference, which have well-established relationships with mortality in various populations documented in dozens of studies, some with thousands or millions of participants [2–4]. These traditional biomarkers have been joined in more recent years by many biomarkers utilizing modern assays, for example genome-wide methylation levels [5], cell-free DNA concentration [6], and leukocyte telomere length [7].
Biomarkers of human mortality are also centrally important to research on human aging, due largely to the long potential duration of prospective studies on human lifespan. This can be a tremendous obstacle both in terms of resources (i.e. money to support such lengthy trials) and delayed progress (i.e. each research result could take decades to obtain). Mortality biomarkers have solved similar problems in the past by providing surrogate endpoints for crucial clinical outcomes, facilitating studies that might otherwise have been prohibitively expensive or time consuming [8,9]. Blood pressure and cholesterol are two of many markers that have played this role in the past, by facilitating cardiovascular research aimed at reducing morbidity and mortality [10]. Such biomarkers have also gained clinical importance as surrogate markers in clinical practice, where treatments are often initiated with the explicit goal of changing a patient’s biomarker value [11–13]. While this approach has important potential drawbacks [8,10], it is certainly more practical for a patient to track how a new intervention affects her blood pressure or serum cholesterol, rather than how it affects her lifespan, which is unknown until death.
Abundant research on mortality biomarkers has resulted in numerous associations documented across hundreds of publications, generating an unwieldy collection of data that can be difficult for researchers or clinicians to interpret or use effectively. There have been no recent attempts to collate this data nor, to our knowledge, to provide tools for locating, organizing, or comparing data from relevant studies. In the present article, we describe an effort to facilitate a more comprehensive and effective approach to evaluating the literature in this area. We present MortalityPredictors.org, a manually-curated, publicly accessible database housing published, statistically-significant relationships in humans between biomarkers and all-cause mortality in population-based or generally healthy samples. To our knowledge, this is the first publicly available resource to collect such information, and we hope it will encourage: 1) the allocation of resources to mortality biomarkers with the greatest potential for accurately predicting human all-cause mortality, 2) efforts to construct multi-biomarker models to further improve such accuracy, and 3) research on human aging and therapies that aim to slow aging or otherwise reduce mortality.
Results
Data description
The initial PubMed query yielded 3,841 publications; these were narrowed to 833 after screening the publication abstracts. Further articles were excluded based on details from the full-text article, and data was finally extracted from the remaining 589 articles, yielding 1,576 reported associations involving 471 unique biomarkers. Figure 1 illustrates the 5 most commonly studied biomarkers in our data set, which encompasses a diverse array of biomarker types, including both blood and urinary biomarkers, numerous physical parameters (BMI, strength, skinfold thickness, etc.), and other features including electrocardiography, spirometry, protein levels, epigenetic features, medical imaging, and others. These types are shown in Table 1, along with descriptive information. The largest number of biomarkers and publications were seen within the “blood” type (i.e. biomarkers assayed via sampling of peripheral blood; Table 2).
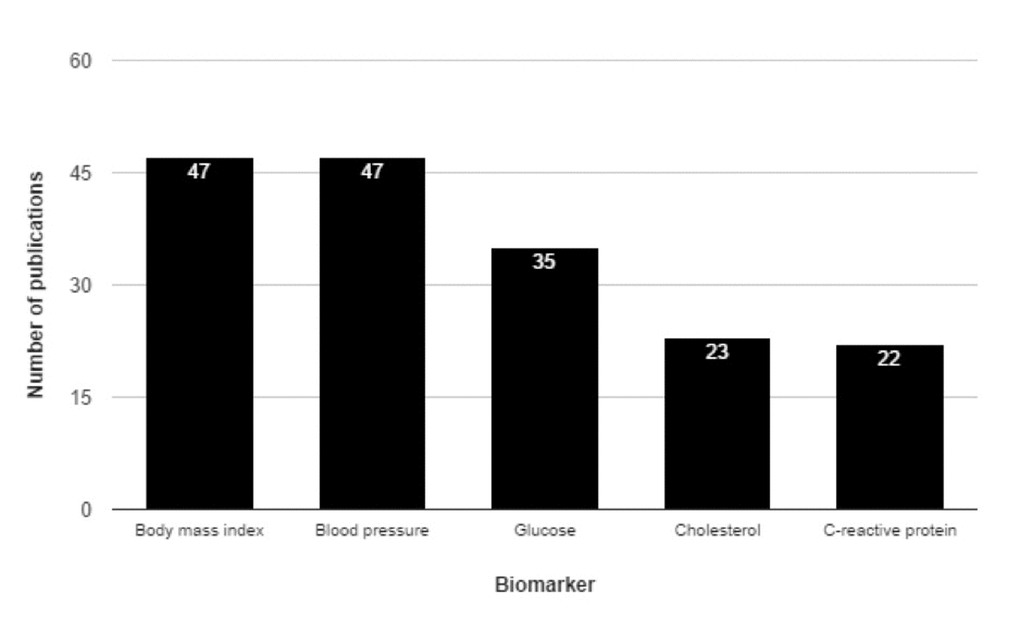
Figure 1. Top five most commonly studied human biomarkers of all-cause mortality by number of publications. The top five most commonly studied biomarkers in the database are shown here. The bar height indicates the number of publications associated with each, and this number is explicitly shown in white near the top of each bar.
Table 1. Biomarker types according to the number of curated biomarkers.
| Biomarkers | Publications | Type | Example biomarkers | Largest normalized effect size |
| 165 | 310 | Blood | Apolipoprotein A-1, Mean corpuscular volume, Lymphocyte percentage | 8.33 |
| 30 | 35 | Composite | Body mass index and leg extensor strength, Lipid accumulation product, Hypothyroidism | 7.93 |
| 10 | 14 | Computed tomography | Bone density, Thigh intramuscular fat, Skeletal muscle density | 12.28 |
| 4 | 4 | Echocardiography | Interventricular septum thickness, Left ventricular ejection fraction, Left ventricular hypertrophy | 6 |
| 61 | 45 | Electrocardiography | Low frequency power of heart rate variability, QRS Transition, counterclockwise rotation, QTc dispersion minimum value | 14.29 |
| 79 | 3 | Epigenetics | cg14575484, cg16197857, cg27635330 | 2.45 |
| 10 | 25 | Exercise test | Exercise capacity, Strength, Cardiorespiratory fitness | 6.67 |
| 22 | 24 | Other | Relative abdominal fat, Basal metabolic rate, Interday rhythm stability | 8.4 |
| 47 | 94 | Physical parameter | Arm circumference, Lean mass index, Body mass index | 16.9 |
| 10 | 58 | Sphygmomanometry | Blood pressure, Pulse pressure, Mean arterial pressure | 4.2 |
| 11 | 14 | Spirometry | Peak expiratory flow, Forced expiratory volume, Forced vital capacity | 4.59 |
| 13 | 12 | Ultrasonography | QUI stiffness, Bone mineral density, Broadband ultrasound attenuation | 4.89 |
| 12 | 23 | Urine | Creatinine excretion, Proteinuria, Sodium (24-hour excreted) | 11 |
Table 2. Top 10 biomarkers by number of publications, within the blood biomarker type.
| Name | Publications | Results | Largest normalized effect size | Best p value |
| Glucose | 35 | 43 | 4.1 | 0.0001 |
| Cholesterol | 23 | 29 | 5.08 | 0.001 |
| C-reactive protein | 22 | 26 | 3.64 | 0.0001 |
| 25-hydroxyvitamin D | 21 | 24 | 4.93 | 0.0001 |
| Estimated glomerular filtration rate | 15 | 22 | 7.8 | 0.0001 |
| Uric acid | 12 | 15 | 2.8 | 0.001 |
| High-density lipoprotein cholesterol | 12 | 12 | 2.38 | 0.0002 |
| White blood cell count | 12 | 31 | 3.33 | 9.22E-31 |
| Glycated hemoglobin | 11 | 14 | 3.2 | 0.001 |
| Testosterone | 11 | 20 | 2.3 | 0.001 |
Browsing the database
The home page for the database (Figure 2) displays summary information about the data and lists four main sections in the database: 1) biomarker types, 2) publications, 3) biomarkers, and 4) all results. These sections present, respectively, all the main types of biomarkers included in the database, all source publications for included data, all studied biomarkers, and all curated associations. The entries in each section can be sorted or filtered by relevant parameters, such as number of publications, publication year, or effect size. Excessively long data fields are truncated, which is signaled by “…” at the end; the full field can be viewed by hovering the mouse over the field of interest.
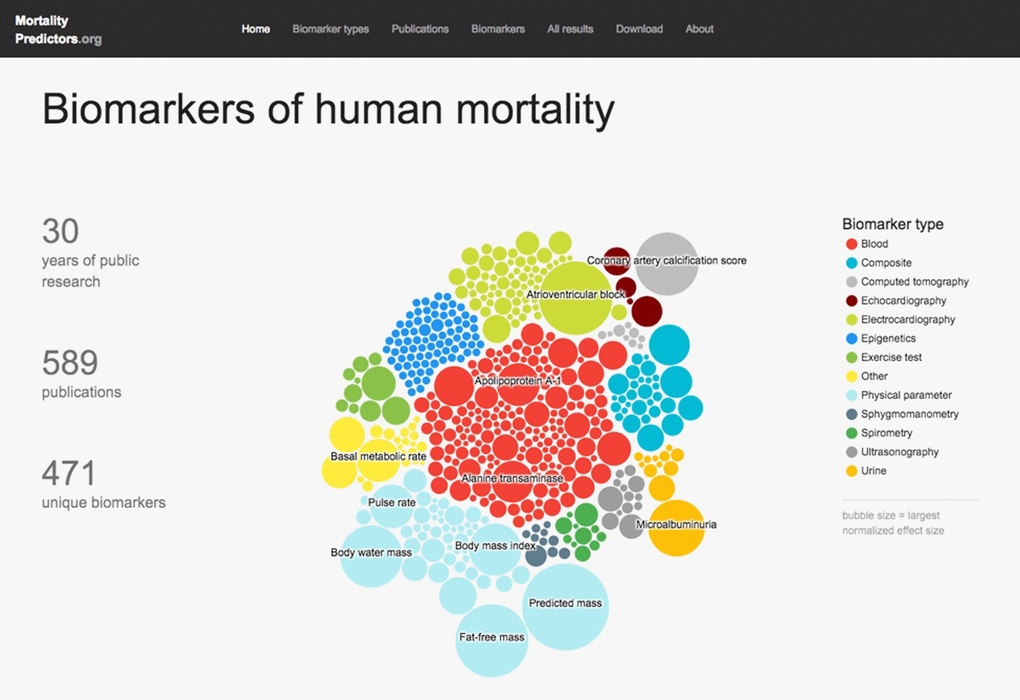
Figure 2. MortalityPredictors.org Database homepage. This is a screen capture of the database home page. Major database statistics are summarized on the left. In the center, an interactive bubble diagram displays a colored bubble for each database biomarker. Each bubble’s color corresponds to the biomarker type (color key shown at right), and the size corresponds to the largest normalized effect size for that marker. Clicking on a bubble leads to the database page for that biomarker. At the top, the main database section labels are shown as hyperlinks that lead to those portions of the database.
Searching the database
Each main section has its own search field that can be used to filter entries based on the primary data field for that section. For instance, one can find a particular biomarker by typing its name into the search field in the “Biomarkers” section.
Downloading the database
Users can easily download the raw data comprising the entire database via a “Download all data” link in the “Downloads” section.
Example use-cases
Finding the biomarker with the strongest published association to all-cause mortality
This is accomplished by navigating to the Biomarkers section and sorting by “Best p value” (by clicking the heading for best p value). This shows that “red blood cell distribution width” has the smallest p value at 1.65e-54 (see Figure 3). Clicking on the name of the biomarker then leads to the individual page for that marker, including basic background information about the marker, as well as entries for each curated association. We can see that p=1.65e-54 was for an association with a normalized hazard ratio (HR) of 4.4, and that the extremely low p-value is mostly likely explained by the extremely large sample size, at more than 227,000 male participants from in the UK Biobank cohort. The analogous association for the 271,000 female participants from this cohort is easily found on the same page, with HR=3.3, p=4.79e-24 for the same comparison.
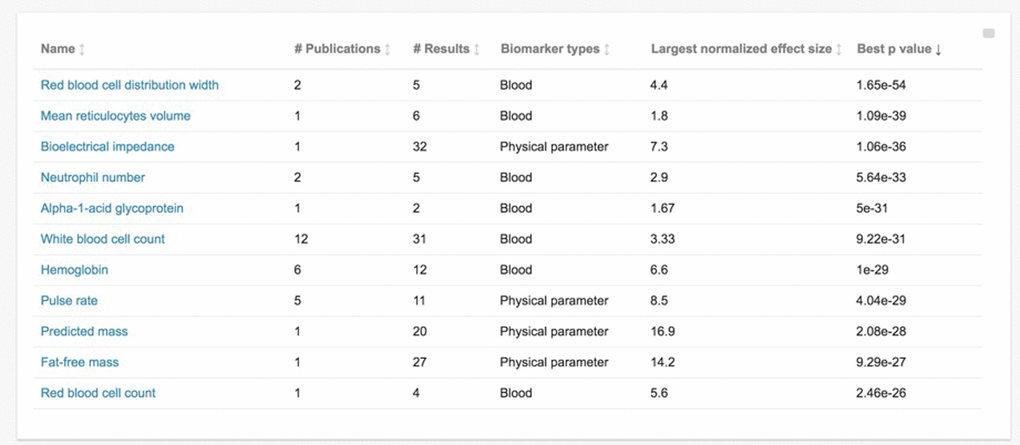
Figure 3. Database biomarkers sorted by statistical significance of their reported associations. This is a screen capture of the database “Biomarkers” section, sorted by “best p-value” for that biomarker in increasing order. “Best p-value” refers to the lowest p-value among curated studies for that biomarker. Other presented information on each biomarker includes the number of curated publications, the number of curated associations resulting from those publications (“# Results”), the biomarker type, and the largest normalized effect size for that biomarker (as defined in the manuscript text).
Finding the peripheral blood biomarker with the largest published effect size
This is accomplished by navigating to the “Biomarker types” section, selecting “Blood”, and sorting the resulting page by “Largest normalized effect size” in descending order (by clicking this heading twice). This reveals that the largest change in risk of all-cause mortality was recorded for Apolipoprotein A-1, which is a major component of high-density lipoprotein (HDL) cholesterol and helps to clear fat from white blood cells and arterial plaques of atherosclerosis. Clicking on the biomarker name “Apolipoprotein A-1” allows the user to further explore its associations, revealing that the study with the largest effect size had a normalized hazard ratio of 8.33 per 1 unit biomarker increase (p=0.029) and was based on a sample of 331 people from a northwest London population sample with a mean follow-up of 24 years.
Discussion
MortalityPredictors.org is a unique resource encompassing 1,587 entries from over 30 years of published research, and catalogs a diverse array of biomarkers, reports details of their relationships with all-cause mortality, and includes relevant meta-data. While certain biomarker databases already exist, for example the Infectious Disease Biomarker Database (IDBD; http://biomarker.cdc.go.kr [14];) and the Early Detection Research Network Biomarker Database (EDRNBD; http://edrn.nci.nih.gov/biomarkers), these are limited to specialized applications or specific diseases and do not share the generalizability of our mandate, which emphasizes a) all-cause mortality and b) human studies in population-based or relatively disease-free cohorts. Some research groups have performed systematic reviews and/or meta-analyses on biomarkers of all-cause mortality, but these have been either within specific domains [15], or limited to very specific time-frames or purposes [1], and have not made their results available as a public database. Other groups have evaluated large panels of candidate biomarkers within specific cohorts, for example 106 metabolites in 10 thousand participants in the Estonian Biobank (Fischer, 2015), but these represent individual studies with little attempt to summarize or collate the work of others. Finally, a number of aging-related databases exist as well, including Human Aging Genomic Resources (HAGR; http://genomics.senescence.info/ [16];), GeroProtectors database (http://geroprotectors.org/ [17];), and the JenAge Aging Factor Database (AgeFactDB; http://agefactdb.jenage.de/ [18];), but none focus on mortality biomarkers and the curation of reported associations.
Applications of MortalityPredictors.org
This publicly-available dataset at MortalityPredictors.org provides an overview of the current state of research on human biomarkers of all-cause mortality, and is of great potential utility for both research and clinical applications. We envision a number of applications that employ its meta-data and search capabilities. These might include:
Identifying optimal biomarkers to assess a therapy’s impact on mortality
Researchers designing studies to measure the potential mortality benefit of a therapy may want to begin by testing its effect on various biomarkers of mortality. If a therapy causes positive changes in those mortality biomarkers, then it might warrant the additional expense and effort of a long-term study to directly assess its true effect on mortality. Such researchers would be able to use MortalityPredictors.org initially to choose which biomarkers to assess in their study sample, and might be interested in selecting those with the most extreme effect sizes that have been reported in the largest number of studies.
Identifying optimal mortality biomarkers of a specific type (e.g. blood, urine)
Researchers interested in mortality biomarkers might have constraints on the type of biomarkers that are useful to them. A retrospective patient cohort might have blood banked on all participants, but no capability for other follow-up testing, so the ability to easily find information on biomarkers of the “blood” type in our database could facilitate experimental design. Alternatively, a prospective cohort in a remote or impoverished area with a limited budget or limited access to technology might be much more amenable to physical parameters that are simple and inexpensive to measure, such as body mass index and blood pressure, rather than molecular or protein-based markers requiring more elaborate testing infrastructure. Such researchers could use MortalityPredictors.org to specifically find biomarkers of the type most appropriate for their study design.
Choosing optimal biomarkers for monitoring overall health
Researchers or clinicians trying to construct an optimal panel of biomarkers for measuring general health -- such as in the context of a broad-purpose cohort study or preventive clinical care -- might wish to go beyond the tests traditionally used to screen for common diseases at recommended ages, and construct a panel of easily measured biomarkers directly associated with mortality. In a clinical context, results from such tests would have to be interpreted and communicated to patients with caution, given the paucity of well-validated research on many biomarkers. Nonetheless, MortalityPredictors.org should be uniquely helpful in designing such a panel.
Performing a systematic review or meta-analysis of mortality biomarkers
Researchers interested in performing a systematic review and/or meta-analysis on any particular mortality biomarker or group thereof could to use the database to ascertain useful parameters to plan their research (such as how many studies are available in the area, the range of test modalities, effect sizes, p-values, etc), to quickly identify a large number of studies on their topic of interest, or to supplement their own independent search strategy with additional articles.
The potential of multi-predictor models
There is great potential for leveraging mortality biomarkers beyond the scope of strategies discussed so far. Importantly, multiple biomarkers can be combined to create indexes that more accurately estimate individual mortality risk than any individual marker [4] [19]. Many such indexes have been created for the prediction of disease risk or of mortality within very specific clinical contexts, and are currently in clinical use. These include the Framingham Risk Score for cardiovascular disease risk [20], the Reynolds Risk Score for cardiac event or stroke risk [21], and the QKidney score for assessment of kidney disease risk [22], among others [23]. The creation of similar indexes, or other sophisticated multi-variable predictors for all-cause mortality will be an important strategy for applying the predictive capability of mortality biomarkers in research and clinical applications. We anticipate that MortalityPredictors.org, by summarizing the known effects of individual markers, will help provide the foundation upon which future work to investigate multi-predictor models can be based.
Conclusions
Mortality biomarkers have played a major role in facilitating healthcare and research for many decades, and promise to have an ever greater role in the near future, given an aging population in many countries, as well as the rise of frailty and age-related deterioration as health as major public health concerns and active targets for new therapies. Studies evaluating therapies that aim to address the roots of frailty within the aging process itself will benefit greatly from research to identify reliable predictors of mortality. These include the landmark Targeting Aging with Metformin (TAME) trial, now underway, as well as future research into promising therapies such as rapamycin and senescent cell removal. The creation of better predictive models for mortality begins with comprehensive, public data about prior biomarker research, toward which effort we contribute MortalityPredictors.org. Our future research will leverage high-throughput “-omics” technologies to screen large numbers of predictors and derive their combinations that most accurately predict mortality. These will be combined with the best predictors from prior research in order to build and validate powerful multi-predictor models that we hope will accelerate clinical research efforts to target and reduce mortality in older adults.
Materials and Methods
Study selection
We identified relevant abstracts by searching the PubMed database (http://www.ncbi.nlm.nih.gov/pubmed) from inception to November 2015 for abstracts reporting on human biomarkers of all-cause mortality studied in either generally-healthy or population-based human samples. We used the query “(biomarker*[Title/Abstract] OR predict*[Title/Abstract] OR associate*[Title/Abstract]) AND ("all-cause mortality"[Title/Abstract] OR "all cause mortality"[Title/Abstract]) NOT (patient[Title/Abstract] OR patients[Title/Abstract])”.
Curation strategy
Each abstract was assessed by a single curator to determine whether the paper reported a statistically significant (nominal p-value < 0.05) association between at least one biomarker and all-cause mortality. Publications reporting only on biomarkers associated with a specific cause of death, such as cancer or cardiovascular mortality, were excluded. Studies of patient groups (i.e. patients suffering from one or more diseases) were excluded. To help ensure that data were not represented more than once in our database, reviews and meta-analyses were also excluded. In cases of uncertainty regarding inclusion or exclusion criteria, consensus among two curators was sought.
The full-text of each retained publication was reviewed and information regarding characteristics of the study, population, biomarker, and association, were extracted. The prospectively-defined fields used in the mortalitypredictors.org database included: 1) biomarker name, e.g. “interleukin-6”; 2) type of test measure, e.g. blood or electrocardiogram; 3) association effect size and its type, e.g. “hazard ratio of 1.5”; 4) the associated p-value; 5) biomarker comparison groups, e.g. “value >5 vs ≤2”; 6) sample size that the association was based on; 7) adjustment covariates for multivariate analysis, e.g. age, sex, smoking status; 7) population characteristics, e.g. age range, predominant ethnicity, geographic area; 8) follow-up time in years; and 9) the official cohort or study name, if applicable. An additional field was then created from this data called “normalized effect size”, which contains either the effect size (for effect sizes ≥1) or one divided by the effect size (for effect sizes <1). Given that the direction of the effect size (i.e. above or below 1) is determined somewhat arbitrarily by the selection of which comparison group in a study will be the “baseline” group, the normalized effect size allows for comparison of effect size magnitudes across studies.
Database construction
The user interface for the database was written primarily in Elm 0.17, which compiles to HTML, CSS, and JavaScript that can be displayed directly in a web browser. The database entries are embedded directly in this interface and thus no separate database server is required. The homepage's interactive data visualization was written with the JavaScript library D3.js 4.4.0. Data cleaning and preparation were done using Python 2.7.12 along with the Jupyter notebook 4.2.1.
Author Contributions
KF and EM designed, planned, and oversaw the study. MVP performed the initial PubMed search and abstract screening, and performed and supervised curation. CDG created the database interface and website. KW and AH assisted in database interface creation and data management. EM, MVP, and KF wrote the paper. All authors have approved the final manuscript.
Acknowledgements
We thank the team at BioAge Labs for helpful discussion and comments on the database and manuscript. We would also like to acknowledge the work of Jennie Sims, Carrie Wong, Juvy Ann Palma, and Jeena Augustine for their assistance in curating data from full-text articles. BioAge Labs provided financial support for this database, and all authors are affiliated with BioAge Labs.
Conflicts of Interest
All authors are affiliated with BioAge Labs.
Funding
BioAge Labs provided financial support for the creation of this database.
References
- 1. Siontis GC, Tzoulaki I, Ioannidis JP. Predicting death: an empirical evaluation of predictive tools for mortality. Arch Intern Med. 2011; 171:1721–26. https://doi.org/10.1001/archinternmed.2011.334 [PubMed]
- 2. Robitaille C, Dai S, Waters C, Loukine L, Bancej C, Quach S, Ellison J, Campbell N, Tu K, Reimer K, Walker R, Smith M, Blais C, Quan H. Diagnosed hypertension in Canada: incidence, prevalence and associated mortality. CMAJ. 2012; 184:E49–56. https://doi.org/10.1503/cmaj.101863 [PubMed]
- 3. Ulmer H, Kelleher C, Diem G, Concin H. Why Eve is not Adam: prospective follow-up in 149650 women and men of cholesterol and other risk factors related to cardiovascular and all-cause mortality. J Womens Health (Larchmt). 2004; 13:41–53. https://doi.org/10.1089/154099904322836447 [PubMed]
- 4. Ganna A, Ingelsson E. 5 year mortality predictors in 498,103 UK Biobank participants: a prospective population-based study. Lancet. 2015; 386:533–40. https://doi.org/10.1016/S0140-6736(15)60175-1 [PubMed]
- 5. Marioni RE,Shah S, McRae AF, Chen BH, Colicino E, Harris SE, Gibson J, Henders AK, Redmond P, Cox SR, Pattie A, Corley J, Murphy L, et al. DNA methylation age of blood predicts all-cause mortality in later life. LGenome Biol. 2015; 16:25. https://doi.org/10.1186/s13059-015-0584-6 [PubMed]
- 6. Jylhävä J, Jylhä M, Lehtimäki T, Hervonen A, Hurme M. Circulating cell-free DNA is associated with mortality and inflammatory markers in nonagenarians: the Vitality 90+ Study. Exp Gerontol. 2012; 47:372–78. https://doi.org/10.1016/j.exger.2012.02.011 [PubMed]
- 7. Rode L, Nordestgaard BG, Bojesen SE. Peripheral blood leukocyte telomere length and mortality among 64,637 individuals from the general population. J Natl Cancer Inst. 2015; 107:djv074. https://doi.org/10.1093/jnci/djv074 [PubMed]
- 8. Fleming TR, DeMets DL. Surrogate end points in clinical trials: are we being misled? Ann Intern Med. 1996; 125:605–13. https://doi.org/10.7326/0003-4819-125-7-199610010-00011 [PubMed]
- 9. Psaty BM, Weiss NS, Furberg CD, Koepsell TD, Siscovick DS, Rosendaal FR, Smith NL, Heckbert SR, Kaplan RC, Lin D, Fleming TR, Wagner EH. Surrogate end points, health outcomes, and the drug-approval process for the treatment of risk factors for cardiovascular disease. JAMA. 1999; 282:786–90. https://doi.org/10.1001/jama.282.8.786 [PubMed]
- 10. Frank R, Hargreaves R. Clinical biomarkers in drug discovery and development. Nat Rev Drug Discov. 2003; 2:566–80. https://doi.org/10.1038/nrd1130 [PubMed]
- 11. James PA, Oparil S, Carter BL, Cushman WC, Dennison-Himmelfarb C, Handler J, Lackland DT, LeFevre ML, MacKenzie TD, Ogedegbe O, Smith SC
Jr , Svetkey LP, Taler SJ, et al. 2014 evidence-based guideline for the management of high blood pressure in adults: report from the panel members appointed to the Eighth Joint National Committee (JNC 8). JAMA. 2014; 311:507–20. https://doi.org/10.1001/jama.2013.284427 [PubMed] - 12. Stone NJ, Robinson JG, Lichtenstein AH, Bairey Merz CN, Blum CB, Eckel RH, Goldberg AC, Gordon D, Levy D, Lloyd-Jones DM, McBride P, Schwartz JS, Shero ST, et al, and American College of Cardiology/American Heart Association Task Force on Practice Guidelines. 2013 ACC/AHA guideline on the treatment of blood cholesterol to reduce atherosclerotic cardiovascular risk in adults: a report of the American College of Cardiology/American Heart Association Task Force on Practice Guidelines. J Am Coll Cardiol. 2014; 63:2889–934. https://doi.org/10.1016/j.jacc.2013.11.002 [PubMed]
- 13. Yudkin JS, Lipska KJ, Montori VM. The idolatry of the surrogate. BMJ. 2011; 343:d7995. https://doi.org/10.1136/bmj.d7995 [PubMed]
- 14. Yang IS, Ryu C, Cho KJ, Kim JK, Ong SH, Mitchell WP, Kim BS, Oh HB, Kim KH. IDBD: infectious disease biomarker database. Nucleic Acids Res. 2008; 36:D455–60. https://doi.org/10.1093/nar/gkm925 [PubMed]
- 15. Barron E, Lara J, White M, Mathers JC. Blood-Borne Biomarkers of Mortality Risk: Systematic Review of Cohort Studies. PLoS ONE. 2015; 10:e0127550. https://doi.org/10.1371/journal.pone.0127550 [PubMed]
- 16. Tacutu R, Craig T, Budovsky A, Wuttke D, Lehmann G, Taranukha D, Costa J, Fraifeld VE, de Magalhães JP. Human Ageing Genomic Resources: integrated databases and tools for the biology and genetics of ageing. Nucleic Acids Res. 2013; 41:D1027–33. https://doi.org/10.1093/nar/gks1155 [PubMed]
- 17. Moskalev A, Chernyagina E, de Magalhães JP, Barardo D, Thoppil H, Shaposhnikov M, Budovsky A, Fraifeld VE, Garazha A, Tsvetkov V, Bronovitsky E, Bogomolov V, Scerbacov A, et al. Geroprotectors.org: a new, structured and curated database of current therapeutic interventions in aging and age-related disease. Aging (Albany NY). 2015; 7:616–28. https://doi.org/10.18632/aging.100799 [PubMed]
- 18. Hühne R, Thalheim T, Sühnel J. AgeFactDB--the JenAge Ageing Factor Database--towards data integration in ageing research. Nucleic Acids Res. 2014; 42:D892–96. https://doi.org/10.1093/nar/gkt1073 [PubMed]
- 19. Calfee CS, Ware LB, Glidden DV, Eisner MD, Parsons PE, Thompson BT, Matthay MA, and National Heart, Blood, and Lung Institute Acute Respiratory Distress Syndrome Network. Use of risk reclassification with multiple biomarkers improves mortality prediction in acute lung injury. Crit Care Med. 2011; 39:711–17. https://doi.org/10.1097/CCM.0b013e318207ec3c [PubMed]
- 20. Lloyd-Jones DM, Wilson PW, Larson MG, Beiser A, Leip EP, D’Agostino RB, Levy D. Framingham risk score and prediction of lifetime risk for coronary heart disease. Am J Cardiol. 2004; 94:20–24. https://doi.org/10.1016/j.amjcard.2004.03.023 [PubMed]
- 21. Ridker PM, Buring JE, Rifai N, Cook NR. Development and validation of improved algorithms for the assessment of global cardiovascular risk in women: the Reynolds Risk Score. JAMA. 2007; 297:611–19. https://doi.org/10.1001/jama.297.6.611 [PubMed]
- 22. Hippisley-Cox J, Coupland C. Predicting the risk of chronic Kidney Disease in men and women in England and Wales: prospective derivation and external validation of the QKidney Scores. BMC Fam Pract. 2010; 11:49. https://doi.org/10.1186/1471-2296-11-49 [PubMed]
- 23. Bello GA, Dumancas GG, Gennings C. Development and Validation of a Clinical Risk-Assessment Tool Predictive of All-Cause Mortality. Bioinform Biol Insights. 2015 (Suppl 3); 9:1–10. https://doi.org/10.4137/BBI.S30172 [PubMed]
- 24. Schneider EL, Guralnik JM. The aging of America. Impact on health care costs. JAMA. 1990; 263:2335–40. https://doi.org/10.1001/jama.1990.03440170057036 [PubMed]
- 25. Bandeen-Roche K, Xue QL, Ferrucci L, Walston J, Guralnik JM, Chaves P, Zeger SL, Fried LP. Phenotype of frailty: characterization in the women’s health and aging studies. J Gerontol A Biol Sci Med Sci. 2006; 61:262–66. https://doi.org/10.1093/gerona/61.3.262 [PubMed]
- 26. Clegg A, Young J, Iliffe S, Rikkert MO, Rockwood K. Frailty in elderly people. Lancet. 2013; 381:752–62. https://doi.org/10.1016/S0140-6736(12)62167-9 [PubMed]
- 27. Iqbal J, Denvir M, Gunn J. Frailty assessment in elderly people. Lancet. 2013; 381:1985–86. https://doi.org/10.1016/S0140-6736(13)61203-9 [PubMed]
- 28. Mitnitski A, Collerton J, Martin-Ruiz C, Jagger C, von Zglinicki T, Rockwood K, Kirkwood TB. Age-related frailty and its association with biological markers of ageing. BMC Med. 2015; 13:161. https://doi.org/10.1186/s12916-015-0400-x [PubMed]
- 29. Shamliyan T, Talley KM, Ramakrishnan R, Kane RL. Association of frailty with survival: a systematic literature review. Ageing Res Rev. 2013; 12:719–36. https://doi.org/10.1016/j.arr.2012.03.001 [PubMed]
- 30. Newman JC, Milman S, Hashmi SK, Austad SN, Kirkland JL, Halter JB, Barzilai N. Strategies and Challenges in Clinical Trials Targeting Human Aging. J Gerontol A Biol Sci Med Sci. 2016; 71:1424–34. https://doi.org/10.1093/gerona/glw149 [PubMed]
- 31. Miller RA, Harrison DE, Astle CM, Fernandez E, Flurkey K, Han M, Javors MA, Li X, Nadon NL, Nelson JF, Pletcher S, Salmon AB, Sharp ZD, et al. Rapamycin-mediated lifespan increase in mice is dose and sex dependent and metabolically distinct from dietary restriction. Aging Cell. 2014; 13:468–77. https://doi.org/10.1111/acel.12194 [PubMed]
- 32. Wilkinson JE, Burmeister L, Brooks SV, Chan CC, Friedline S, Harrison DE, Hejtmancik JF, Nadon N, Strong R, Wood LK, Woodward MA, Miller RA. Rapamycin slows aging in mice. Aging Cell. 2012; 11:675–82. https://doi.org/10.1111/j.1474-9726.2012.00832.x [PubMed]
- 33. Tchkonia T, Zhu Y, van Deursen J, Campisi J, Kirkland JL. Cellular senescence and the senescent secretory phenotype: therapeutic opportunities. J Clin Invest. 2013; 123:966–72. https://doi.org/10.1172/JCI64098 [PubMed]