


Introduction
Pancreatic cancer (PC) is one of the foremost common malignant tumours in the digestive system, with the characteristics of insidious onset, rapid progression, and poor prognosis; therefore, the 5-year survival rate is simply 2%-9% [1]. In the United States, PC was the third leading explanation for tumour-related death, with an estimated 62,210 new cases and 49,830 deaths of PC in 2022 [2]. By 2030, PC is anticipated to rank as the second most common cancer-related cause of death [3]. In recent years, the treatment and prognosis of PC have not significantly improved. Surgery combined with adjuvant systemic chemotherapy is the mainstay for PC. However, because of the shortage of typical symptoms within the early stage of PC, most patients square measure already within the middle and advanced stages after they present with symptoms and thus lose the opportunity for radical surgery; only 10%-20% of patients can receive surgical treatment [4]. Chemotherapy remains the primary treatment option for patients with metastatic PC. But even with first-line chemotherapy regimens like FOLFIRINOX (fluorouracil, oxaliplatin, irinotecan, and leucovorin) or gemcitabine combined with nab-paclitaxel, the response rate for PC is only about 30% [5]. In recent years, targeted therapy and immunotherapy have created great progress, revolutionizing the treatment of cancers like hepatocellular carcinoma, non-small cell lung cancer, and nephritic cell carcinoma [6–9]. However, targeted therapy and immunotherapy have not achieved the desired effect for PC due to the complex, highly immunosuppressive tumour microenvironment [10, 11]. Hence, it's still important and imperative to explore the mechanisms of PC development as well as find effective treatment methods.
Endoplasmic reticulum is the central organelle that functions in protein synthesis, folding, and modification. Although this process is finely regulated, a variety of cellular internal and external factors can disrupt the ability of endoplasmic reticulum to fold proteins and trigger endoplasmic reticulum stress (ERS) characterized by the accumulation of misfolded or unfolded proteins [12]. Tumour cells are often exposed to various factors that affect protein homeostasis (e.g., hypoxia, nutrient deficiency, acidosis, oncogenic activation, changes in chromosome number, and increased secretory capacity), resulting in persistent ERS, which ultimately affects tumour cell function and survival [13]. In response to ERS, cells activate a range of adaptive mechanisms to enhance folding and clearance and restore protein balance within the endoplasmic reticulum, called the unfolded protein response (UPR) [14]. UPR can favour cell survival, help reduce the buildup of misfolded proteins, and restore the function of the endoplasmic reticulum. If ERS cannot be addressed, the UPR signal will switch from survival to pro-apoptosis [15]. In mammalian cells, UPR is initiated primarily by three endoplasmic reticulum transmembrane proteins, including IRE1α, PERK, and ATF6 [14, 16]. Many studies have demonstrated that UPR activation is associated with many characteristics of cancer, including angiogenesis, genomic instability, cell proliferation, invasion and dormancy, chemotherapy resistance, and tumour immunity [13, 17]. Pereira et al. [18] found that positive angiogenic regulatory factors (including VEGFA, FGF2, angiogenin, and IL8) were significantly upregulated during ERS, and activation of UPR could promote the expression of VEGFA mRNA and protein more effectively than hypoxia, thus promoting angiogenesis. Study from Cubillos-Ruiz et al. [19] showed that activation of ERS response factor XBP1 induced the biosynthesis of triglycerides in tumour-associated dendritic cells, resulting in abnormal lipid accumulation and inhibition of the ability of tumour-associated dendritic cells to support anti-tumour T cells, thereby promoting the progression of ovarian cancer. Adjuvant therapies such as chemotherapy and targeted therapy are important means to improve the survival time for cancer patients. However, their effectiveness is challenged by multiple drug resistance mechanisms formed by tumour cells before and during treatment, including reduced drug uptake, drug target change, repair of drug-induced harm, and unfitness to drug-induced cell death [20]. Salaroglio et al. [21] showed that PERK mediated Nrf2-driven MRP1 transcription, thereby inducing tumour cell resistance to ERS and chemotherapy. Presently, the specific mechanism of ERS in PC has not been comprehensively studied. Exploring the molecular characteristics and roles of endoplasmic reticulum stress-related genes (ERGs) in PC may help find new strategies for diagnosis and treatment.
Based on this evidence, we first identified the ERS-related molecular subtypes and prognostic signature for PC by comprehensive bioinformatics analysis and in vitro and in vivo experiments.
Materials and Methods
Data acquisition and preprocessing
The RNA expression data as well as clinical information (containing 185 cases of PC samples) were acquired via The Cancer Genome Atlas (TCGA) platform (https://portal.gdc.cancer.gov/). In addition, the copy number variation (CNV), methylation and somatic mutation data of thirty-three kinds of cancer from TCGA database were acquired to explore the genetic variations for ERGs in pan-cancer. GSE28735 (containing 45 cases of PC), GSE62452 (containing 69 cases of PC), GSE57495 (containing 63 cases of PC) and GSE85916 (containing 80 cases of PC) datasets were acquired via the Gene Expression Omnibus (GEO) platform (https://www.ncbi.nlm.nih.gov/geo/). Genotype-Tissue Expression Project (GTEx) (including 167 cases of pancreatic tissue from healthy people) was acquired via the UCSC Xena platform (https://xenabrowser.net/datapages/). Using the “sva” package to get rid of batch effects among totally different datasets [22, 23]. Samples with a survival time of less than 30 days were excluded for survival analysis. ERGs were acquired through the Molecular Signatures Database (MSigDB, http://www.gsea-msigdb.org/) [24]. Differentially expressed genes (DEGs) were identified between the pancreatic tumour and normal tissue from TCGA and GTEx datasets by using the “limma” R package with the filter condition of |log2 fold change (FC)| > 1 as well as adjusted p-values < 0.05. Then, the intersection of DEGs and ERGs was identified for follow-up analysis.
Consensus clustering
We first combined all the PC patients from the TCGA, GSE28735, GSE62452, GSE57495 and GSE85916 datasets, then used the "ConsensusClusterPlus" package to conduct an unsupervised cluster analysis based on the differentially expressed ERGs. The optimal cluster number was determined using the consensus matrix and the cumulative distribution function (CDF) curve. Every patient could be grouped into different subtypes (ERGcluster A and B). The principal component analysis (PCA) with good dimensionality reduction ability was used to illustrate the consistency of the cluster. Survival times between different subtypes were compared utilizing Kaplan-Meier curve. Gene set variation analysis (GSVA) as well as gene set enrichment analysis (GSEA) were performed to compare the differences in biological behaviour in different subtypes [25]. Single-sample gene set enrichment analysis (ssGSEA) was performed to explore the variations of pancreatic tumour immune microenvironment between different subtypes.
Enrichment analysis and immune analysis
GSVA as well as GSEA were performed to compare the differences in the enriched pathways in the different ERS score groups [25]. To further explore the variations of pancreatic tumour immune microenvironment between different clusters and between different ERS score groups, ssGSEA was performed to compute a total of 28 immune cell infiltration scores for each sample through the “GSVA” and “GSEABase” packages. What’s more, the proportions of 22 immune cells were computed for each sample by CIBERSORT algorithm [27]. The p-value < 0.05 represented that the infiltration assessment of 22 immune cell subtypes for PC was accurate, and these samples were utilized to further analysis.
Mutation analysis and drug sensitivity analysis
Utilizing the “maftools” package to investigate and visualize the mutation landscape in both high and low ERS score groups. 38Mb is routinely extracted according to the length of human exons, so tumour mutation burden (TMB) per sample was calculable to be up to the whole mutation frequency divided by 38 Mb [28]. Subsequently, the association between ERS score and TMB was further evaluated.
The “OncoPredict” package has a predictive effect on in vivo drug responses for patients with malignant tumours [29]. It can fit the gene expression data to the semi-maximum inhibitory concentration of neoplastic cell lines for medication in Genomics of Drug Sensitivity in Cancer (https://www.cancerrxgene.org/). The “OncoPredict” package was utilized to assess the variations in drug sensitivity between different PC patients. For further assessing the correlation between model gene and drug sensitivity, we downloaded relevant gene expression data and Food and Drug Administration approved drug sensitivity data from the CellMiner database (https://discover.nci.nih.gov/cellminer/) [30].
Gene expression analysis and single-cell analysis
GEPIA database (http://gepia.cancer-pku.cn/) is an open platform that can analyze gene expression difference, correlation, and prognostic value [31], which was employed for investigating gene expression variations between pancreatic tumour and normal tissues. The Human Protein Atlas (HPA) (version 22.0 https://www.proteinatlas.org/) is a public platform designed for creating maps of protein expression patterns [32], which was employed for investigating the distribution and expressed variations of genes in the model. Single-cell RNA-seq offers transcription data from a single cell. The Tumour Immune Single-Cell Hub (TISCH) database (http://tisch.comp-genomics.org) is a single-cell RNA-seq platform immersed in tumour microenvironment [33, 34], which was employed for investigating the proportion of each cell subset in the pancreatic tumour.
Cell lines and tissues
HPDE6-C7, a human pancreatic ductal epithelium cell line, was obtained through the American Type Culture Collection (ATCC, Manassas, VA, USA). Human PC cell lines (CF-PAC1 as well as Panc-1) were obtained from Procell Life Science and Technology Co., Ltd. And KeyGEN BioTECH (Jiangsu province, China) supplied the human PC cell line BxPC-3. Seven pairs of pancreatic tumour tissues and paracancer tissues were obtained from PC patients operated on at the First Affiliated Hospital of Dalian Medical University. All acquired tissues are immediately flash-frozen in liquid nitrogen and kept at -80° C. Informed consent was obtained from the patients participating in this study.
Real-time quantitative PCR
Total RNAs were extracted from cell lines and tissues by an extraction reagent, TRIzol (Accurate Biotechnology, Shanghai, China). Subsequently, reverse transcription was performed to acquire cDNAs. Finally, real-time quantitative PCR (RT-qPCR) was conducted using SYBR® Green Premix Pro Taq HS qPCR Kit (Accurate Biotechnology, Shanghai, China). And GAPDH was used as a control reference, utilizing ΔΔCt technique for quantifying RNA expression. We acquired primer sequences through GenePharma (Suzhou, China), for human KRT7 (Forward: 5’-CCAGGAGGAGAGCGAGCAGATC-3’; Reverse: 5’-GCAGCAGCGTCCACTTGGTC-3’), MUC16 (Forward: 5’-CATTACCAGCAAGTAGCCACTCCTC-3’; Reverse: 5’-CGTCCAACACCTCAGTAGTCTTCAC-3’); MET (Forward: 5’-GTCCTATGGCTGGTGGCACTTTAC-3’; Reverse: 5’-TGGTTTGGGCTGGGGTATAACATTC-3’).
Statistical analysis
R (version 4.1.2) and GraphPad Prism 9 were utilized for statistical analysis and visualization in the current investigation. For metric data with a normal distribution, utilizing t-test to perform the differential analysis. For metric data without a normal distribution, Wilcoxon’s rank sum test was utilized for comparison between two groups, and the Kruskal-Wallis test was utilized for comparison among multiple groups. Utilizing the Spearman or Pearson test to perform the correlation analysis. Utilizing the Kaplan–Meier method to perform survival analysis. A p-value < 0.05 represented statistical significance.
Results
Identification and pan-cancer analysis of ERGs
The process of this study was shown in Figure 1. Based on TCGA and GTEx databases, we obtained 5552 DEGs in tumour tissue and normal tissue of the pancreas (Figure 2A). 15 endoplasmic reticulum stress-related gene sets with a total of 660 genes were obtained from MSigDB (Supplementary Table 1). After 348 duplicate genes were removed, 312 ERGs remained (Supplementary Table 2). Then the intersection of DEGs and ERGs was used to acquire 99 differentially expressed ERGs (Figure 2B). The univariate Cox regression analysis revealed 38 ERGs were related to the prognosis of PC (Figure 2C).
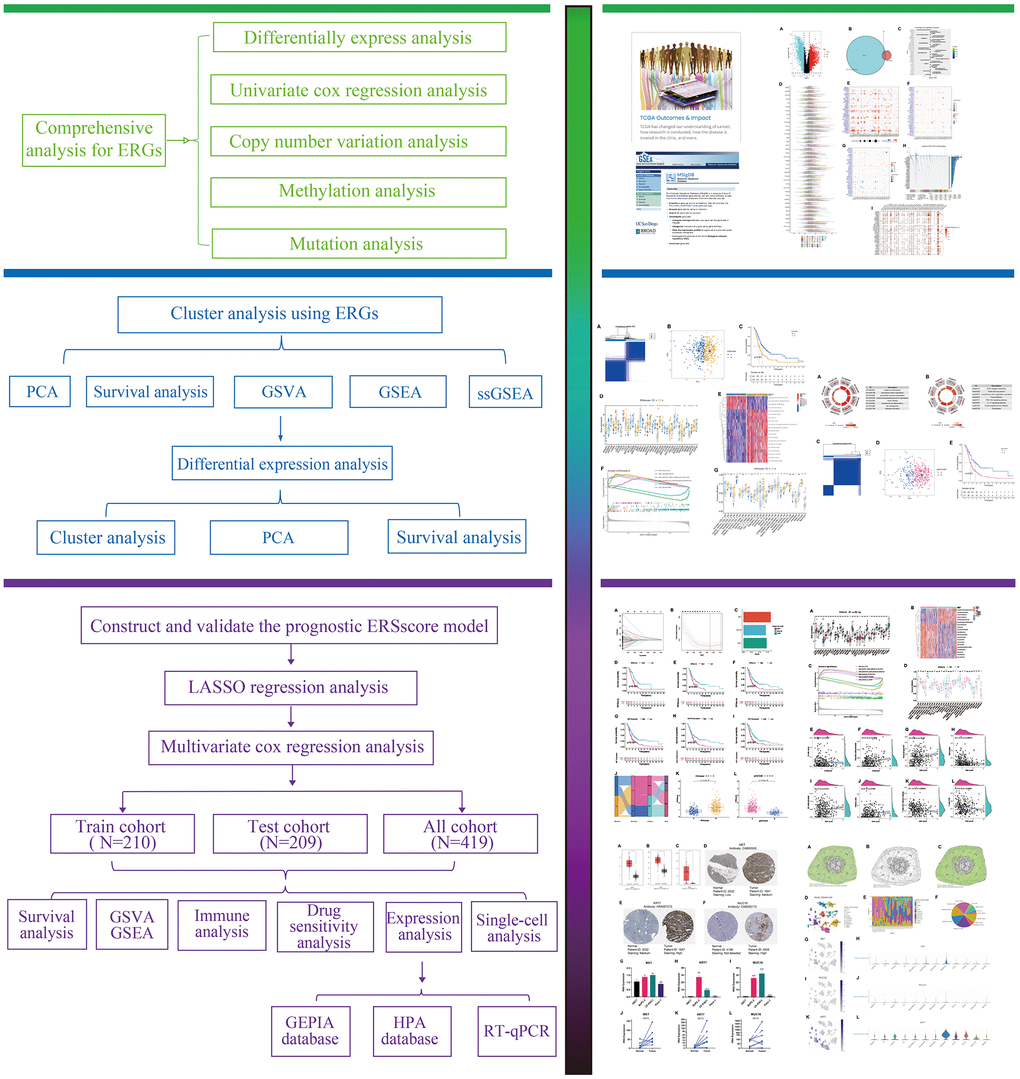
Figure 1. The flowchart of this study.
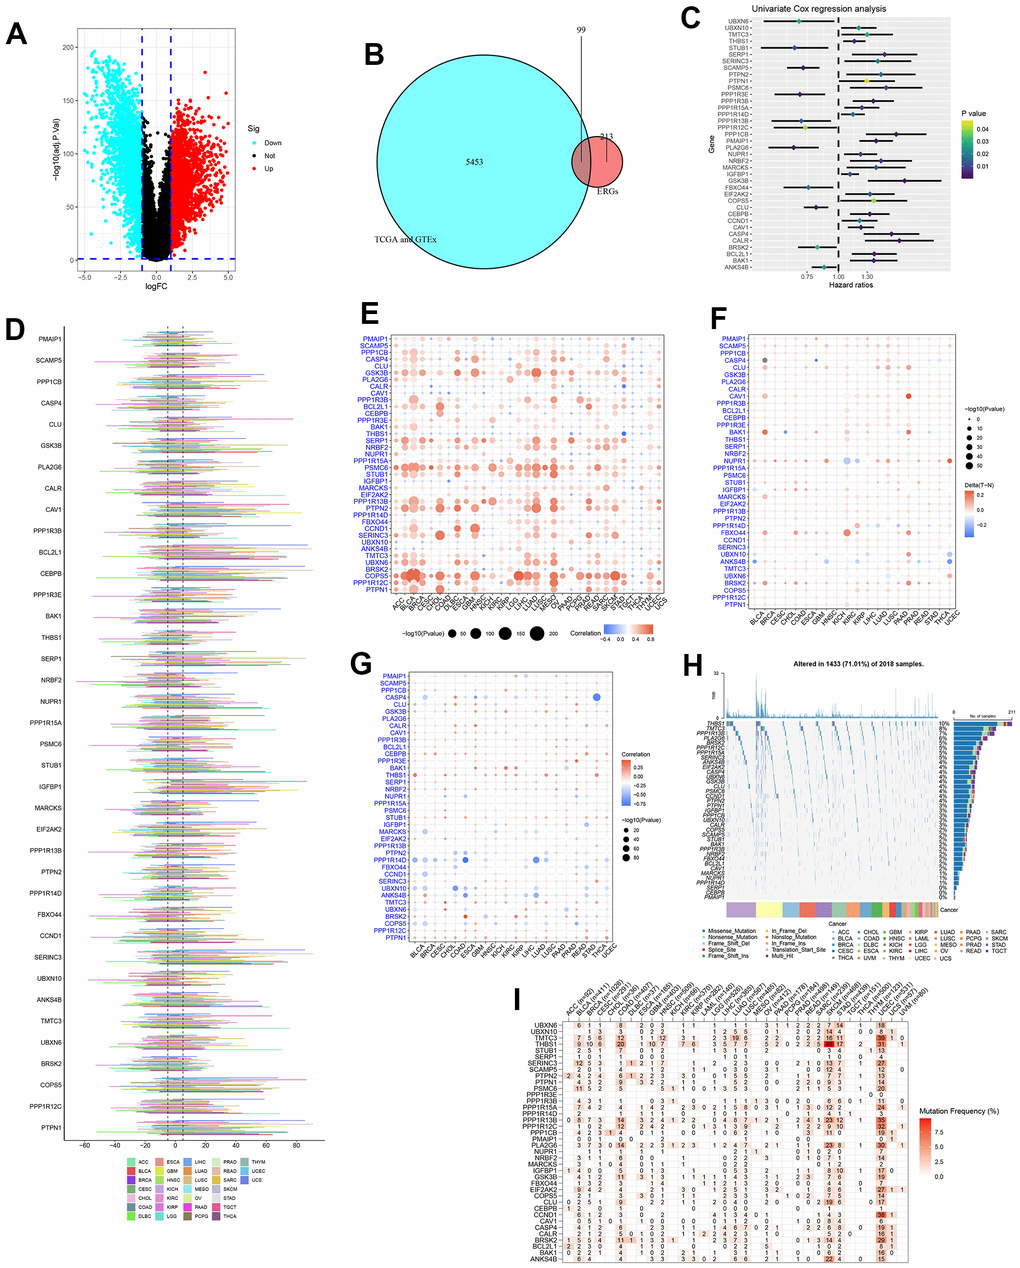
Figure 2. Identification and pan-cancer analysis of endoplasmic reticulum stress-related genes (ERGs). (A) The differentially expressed genes (DEGs) between pancreatic tumours and normal tissues. (B) The intersection of DEGs and ERGs. (C) Univariate Cox regression analysis for ERGs. (D) The copy number variation (CNV) of ERGs within pan-cancer. (E) The correlation between CNV and expression. (F) Methylation difference of ERGs between tumour and normal tissues. (G) The correlation between methylation and expression. (H) The oncoplot of ERGs mutation within pan-cancer. (I) Mutation frequency of ERGs.
The genetic changes of 38 ERGs in pan-cancer were further assessed. And the results found the CNV frequency of ERGs was generally more than 5% in most cancer types except thyroid carcinoma (THCA), the CNV types of genes CAV1, BCL2L1, CEBPB, IGFBP1, SERINC3, COPS5, and PTPN1 were mainly amplification; the CNV types of gene BRSK2 were mainly deletion; and the CNV types of most ERGs in uterine carcinosarcoma (UCS) and testicular germ cell tumors (TGCT) were mainly amplification, which was the opposite trend in diffuse large B-cell lymphoma (DLBC) and kidney renal papillary cell carcinoma (KIRP) (Figure 2D). The CNV and expression levels of ERGs showed a remarkably positive correlation in most cancer types. For instance, the expression of COPS5 has a remarkably positive correlation with CNV in bladder urothelial carcinoma (BLCA), lower grade glioma (LGG), skin cutaneous melanoma (SKCM) (Figure 2E). These revealed that the CNV for ERGs was a common genetic alteration and was associated with gene expression within most tumours. Besides, DNA methylation could also affect gene expression and be linked to carcinogenesis. We analysed the methylation difference between tumour and normal tissues, and results manifested the most ERGs were hypermethylated within most malignancies, while ANKS4B was hypomethylated within most cancers types (Figure 2F). We found a complex relationship between gene methylation and expression. The relationship between methylation and expression of genes GSK3B, THBS1, and PTPN1 manifested a positive correlation in most tumour types, whereas this was reversed for genes PPP1R14D (Figure 2G). Finally, the mutation of ERGs in pan-cancer was evaluated. The most common type of genetic mutation was missense mutation, and the top four ERGs with the highest mutation frequency were THBS1 (10%), TMTC3 (8%), PPP1R13B (7%), and PLA2G6 (6%) (Figure 2H). The top four cancer types with a relatively high mutation frequency were SKCM, uterine corpus endometrial carcinoma (UCEC), colon adenocarcinoma (COAD) and stomach adenocarcinoma (STAD) (Figure 2I).
Identification of ERS-related molecular subtypes
All samples in the TCGA, GSE28735, GSE62452, GSE57495 and GSE85916 datasets were pooled, and then unsupervised cluster analysis was performed to identify the ERS-related molecular feature for PC. The CDF curve indicated the optimal cluster number was 2 (Supplementary Figures 1, 2). All samples were classified into two clusters: ERGcluster A and B (Figure 3A). PCA could clearly distinguish PC patients with different ERS-related molecular features (Figure 3B). Survival analysis revealed that the prognosis of ERGcluster A was considerably better than that of ERGcluster B (Figure 3C). Most ERGs were highly expressed in ERGcluster B, indicating that ERGcluster B may have a higher ERS level (Figure 3D).
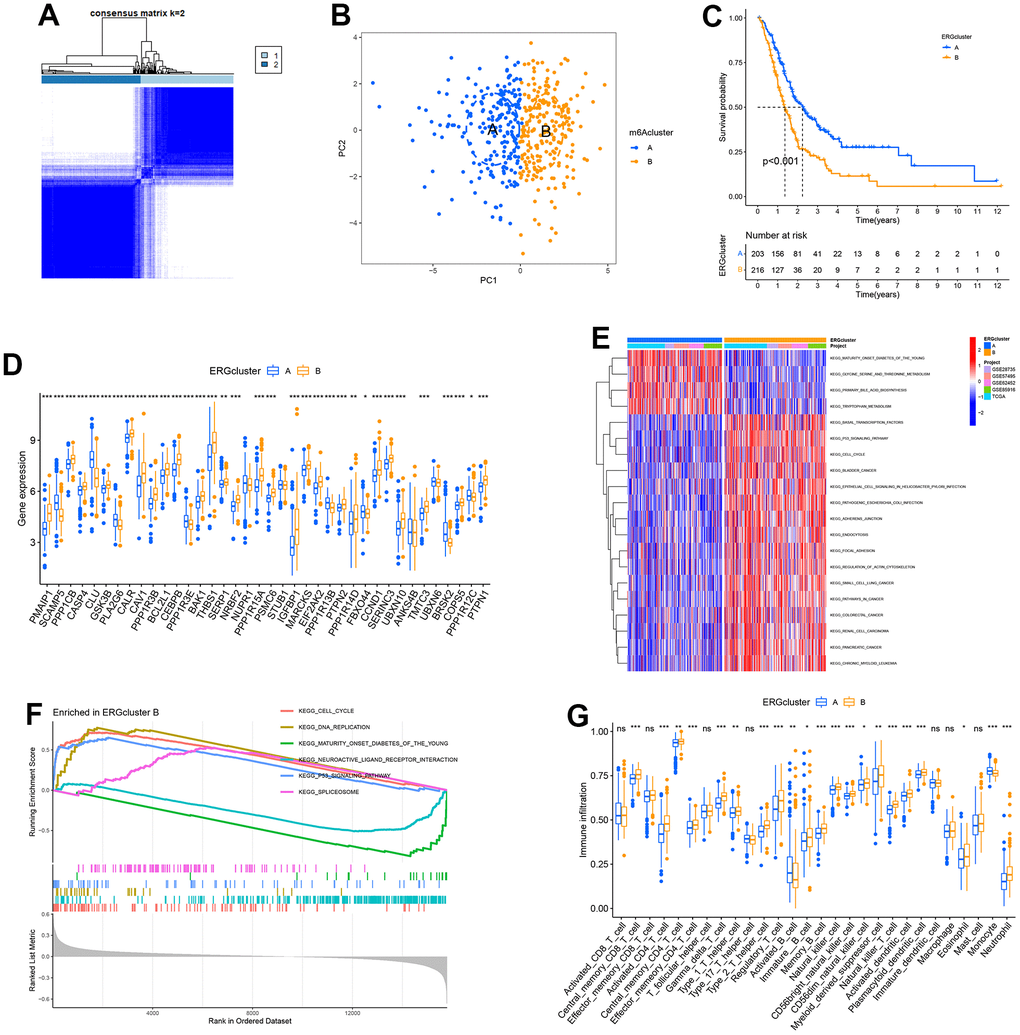
Figure 3. Identification of endoplasmic reticulum stress (ERS)-related molecular subtypes. (A) Heatmap of consensus matrix when k = 2. (B) The principal component analysis could remarkably distinguish ERGcluster A and B. (C) The survival curve of ERGcluster A and B. (D) The expression difference of endoplasmic reticulum stress-related genes (ERGs) between ERGcluster A and B. (E) GSVA analysis. (F) GSEA analysis. (G) ssGSEA analysis. (*p<0.05; **p<0.01; ***p<0.001).
GSVA showed that the remarkable enrichment pathways in ERGcluster A included “primary bile acid biosynthesis”, “tryptophan metabolism”, “maturity onset diabetes of the young”, etc. The remarkable enrichment pathways in ERGcluster B contained “basal transcription factors”, “p53 signaling pathway”, “cell cycle”, “focal adhesion”, “pathways in cancer”, and “pancreatic cancer”, and these enrichment pathways may be associated with the poorer prognosis in ERGcluster B (Figure 3E). GSEA suggested that “cell cycle”, “DNA replication”, “p53 signaling pathway” and “spliceosome” were remarkably enriched in ERGcluster B, “maturity onset diabetes of the young”, and “neuroactive ligand receptor interaction” were remarkably enriched in ERGcluster A (Figure 3F), which was consistent with the GSVA result.
For understanding the variations of the tumour immune microenvironment in different ERS-related molecular features, ssGSEA was carried out. The results indicated that the infiltration level in activated B cells and monocytes was significantly higher in ERGcluster A, and activated CD4+ T cells, activated dendritic cells (DC), immature B cells, natural killer (NK) cells, neutrophils, regulatory T cells (Tregs), myeloid-derived suppressor cells (MDSCs), and type 1 and type 2 T helper cells had a significantly higher infiltration score in ERGcluster B (Figure 3G).
Differentially expressed analysis in the different ERS-related molecular subtypes
For further exploring the variations between different ERS-related molecular subtypes, we screened 164 ERS-related DEGs between ERGcluster A and B (Supplementary Figure 3). Univariate Cox regression revealed 99 ERS-related DEGs were related to the prognosis in PC (Supplementary Figure 4). GO enrichment analysis showed the 99 ERS-related DEGs were considerably enriched in “epidermis development”, “extracellular matrix organization”, “wound healing”, “skin development”, etc. (Figure 4A). KEGG pathway enrichment analysis indicated the 99 ERS-related DEGs were considerably enriched in “ECM−receptor interaction”, “Complement and coagulation cascades”, “PI3K−Akt signaling pathway”, “IL−17 signaling pathway”, etc. (Figure 4B). Subsequently, consensus clustering analysis was carried out based on the 99 ERS-related DEGs, and all samples were classified into two clusters: geneCluster A and B (Figure 4C). PCA could clearly distinguish the different patients between geneCluster A and B (Figure 4D). Survival analysis indicated the prognosis of geneCluster A was remarkably worse than geneCluster B (Figure 4E).
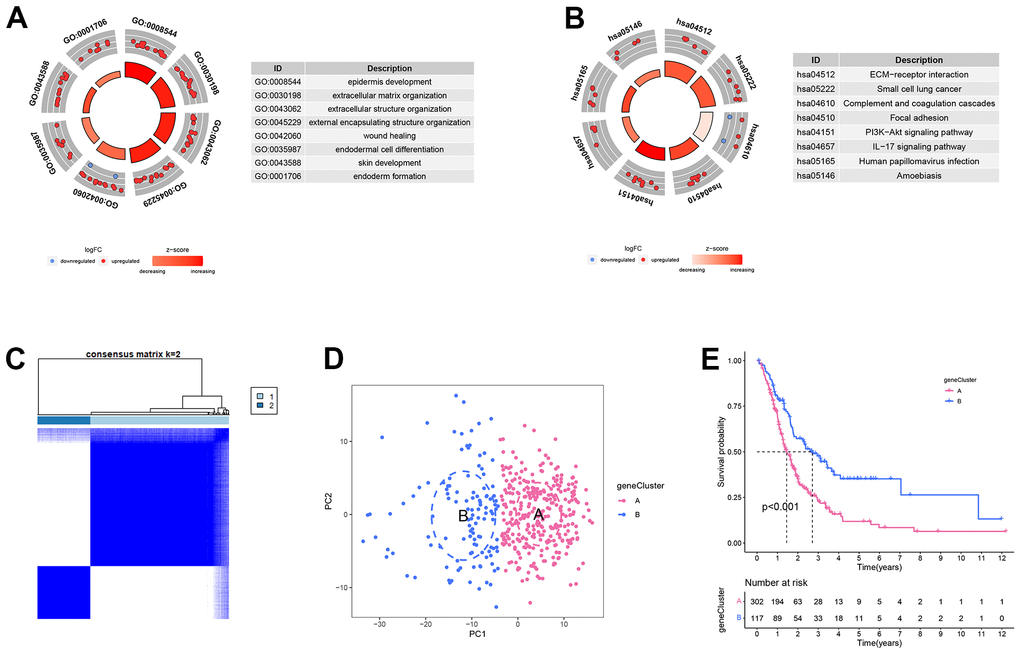
Figure 4. Differentially expressed analysis in the different endoplasmic reticulum stress-related subtypes. (A) GO enrichment analysis. (B) KEGG enrichment analysis. (C) Heatmap of consensus matrix when k = 2. (D) The principal component analysis could remarkably distinguish geneCluster A and B. (E) The survival curve of geneCluster A and B.
Establishment of ERS-related prognostic model
For further quantifying the ERS state for a single sample, all samples from the TCGA, GSE28735, GSE62452, GSE57495 and GSE85916 datasets were combined and then randomly grouped into training and verification cohorts using a ratio of 5:5. Then LASSO and multivariate Cox regression analysis were performed to establish a three-gene ERS-related model utilizing the ERS-related DEGs (Figure 5A–5C). Survival analysis showed that in the training, validation and whole cohort, the survival time of patients with a low ERS score was remarkably longer than those with a high ERS score (Figure 5D–5F). In addition, Kaplan–Meier survival curves indicated that high expression of MET, MUC16, and KRT7 were related to worse survival in PC (Figure 5G–5I). Alluvial diagram indicated the low ERS score group mainly corresponded to ERGcluster A and geneCluster B, while high ERS score patients mostly corresponded to ERGcluster B and geneCluster A (Figure 5J). The ERS score of patients in ERGcluster A was remarkably lower compared to ERGcluster B (Figure 5K), and the ERS score of patients in geneCluster B was remarkably lower compared to geneCluster A (Figure 5L). We then examined the relationships between the model genes and ERGs, and the findings revealed that model genes were remarkably positively correlated with most ERGs, while negatively correlated with SCAMP5, PLA2G6, CLU and BRSK2 (Supplementary Figure 5). The association between the ERS score and the clinicopathological characteristics of PC was assessed in this study. The findings demonstrated that at high pathological grade, ERS score was remarkably higher (Supplementary Figure 6). High TNM stage patients had ERS score that were higher than low TNM stage patients, but the difference was not statistically significant, which may have been caused by the small sample size (Supplementary Figure 7). Additionally, ERS score was found to be an independent risk factor for a poor outcome in PC by univariate and multivariate Cox regression (Supplementary Figure 8).
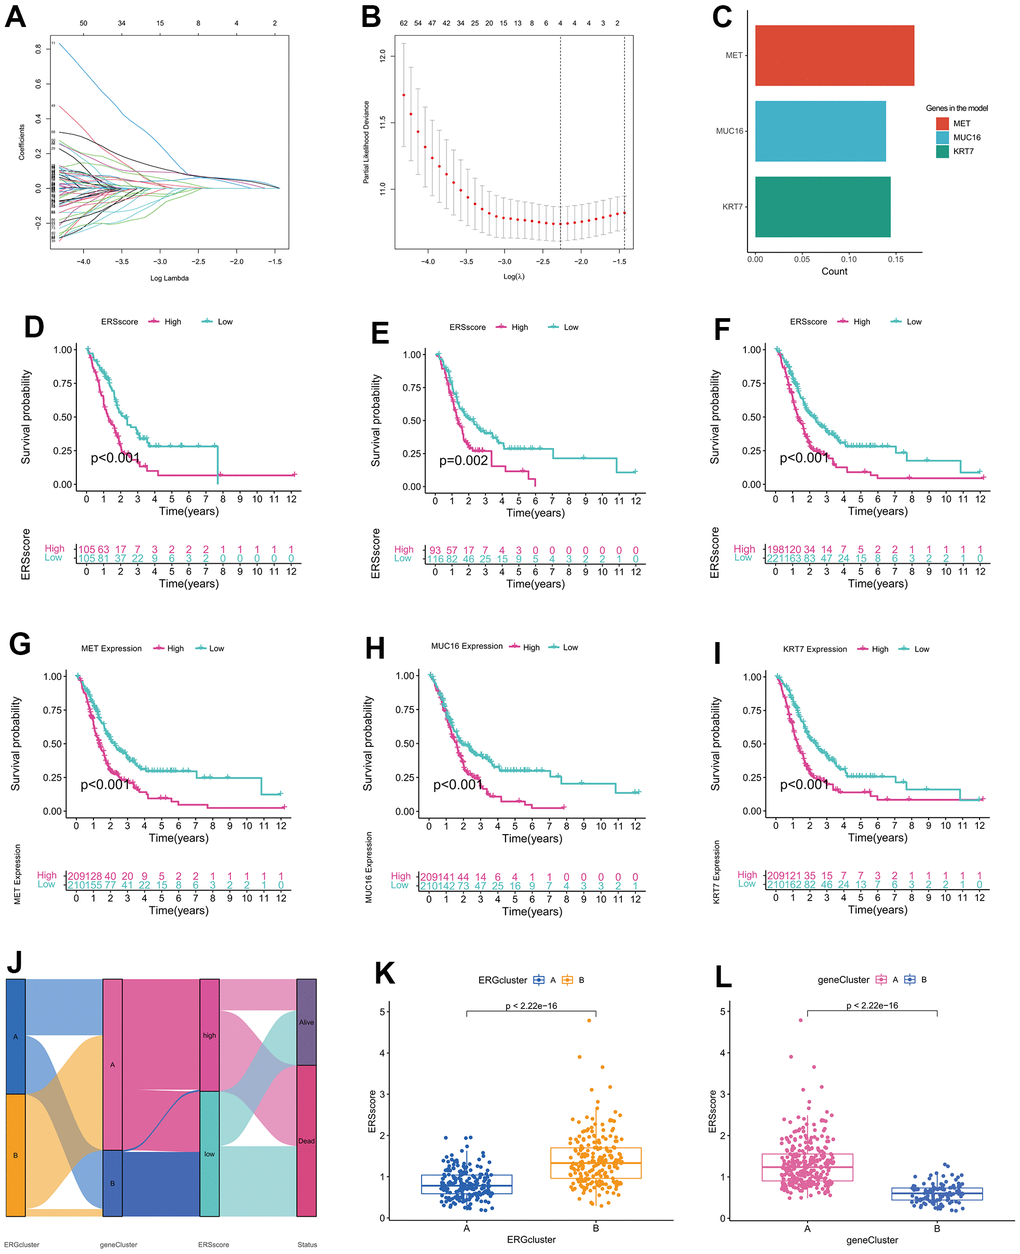
Figure 5. Establishment of endoplasmic reticulum stress-related prognostic model. (A) Coefficient path diagram for LASSO regression. (B) The cross-validation curve. (C) Coefficients of MET, MUC16, and KRT7 in the model. Survival curve of the training cohort (D), validation cohort (E), and whole cohort (F). Survival curve between high-expression and low-expression groups of MET (G), MUC16 (H), and KRT7 (I). (J) Alluvial diagram of changes in ERGclusters, geneClusters, ERS score and survival state. (K) The difference of ERS score between ERGcluster A and B. (L) The difference of ERS score between geneCluster A and B.
GSVA, GSEA and immune analysis
Compared to the patients in the low ERS score group, most ERGs were considerably higher expressed in the high ERS score group, which indicated a higher ERS degree in the patients with a high ERS score (Figure 6A). GSVA found that the remarkable enrichment pathways within the low ERS score group included “neuroactive ligand-receptor interaction”, “tryptophan metabolism”, “calcium signaling pathway”, etc. By contrast, “p53 signaling pathway”, “nucleotide excision repair”, “pancreatic cancer”, “cell cycle” and “pathways in cancer” were considerably enriched in the high ERS score group (Figure 6B). GSEA also indicated “p53 signaling pathway” and “cell cycle” were remarkably enriched in the high ERS score group, and “neuroactive ligand-receptor interaction” and “maturity-onset diabetes of the young” were considerably enriched in the low ERS score group (Figure 6C).
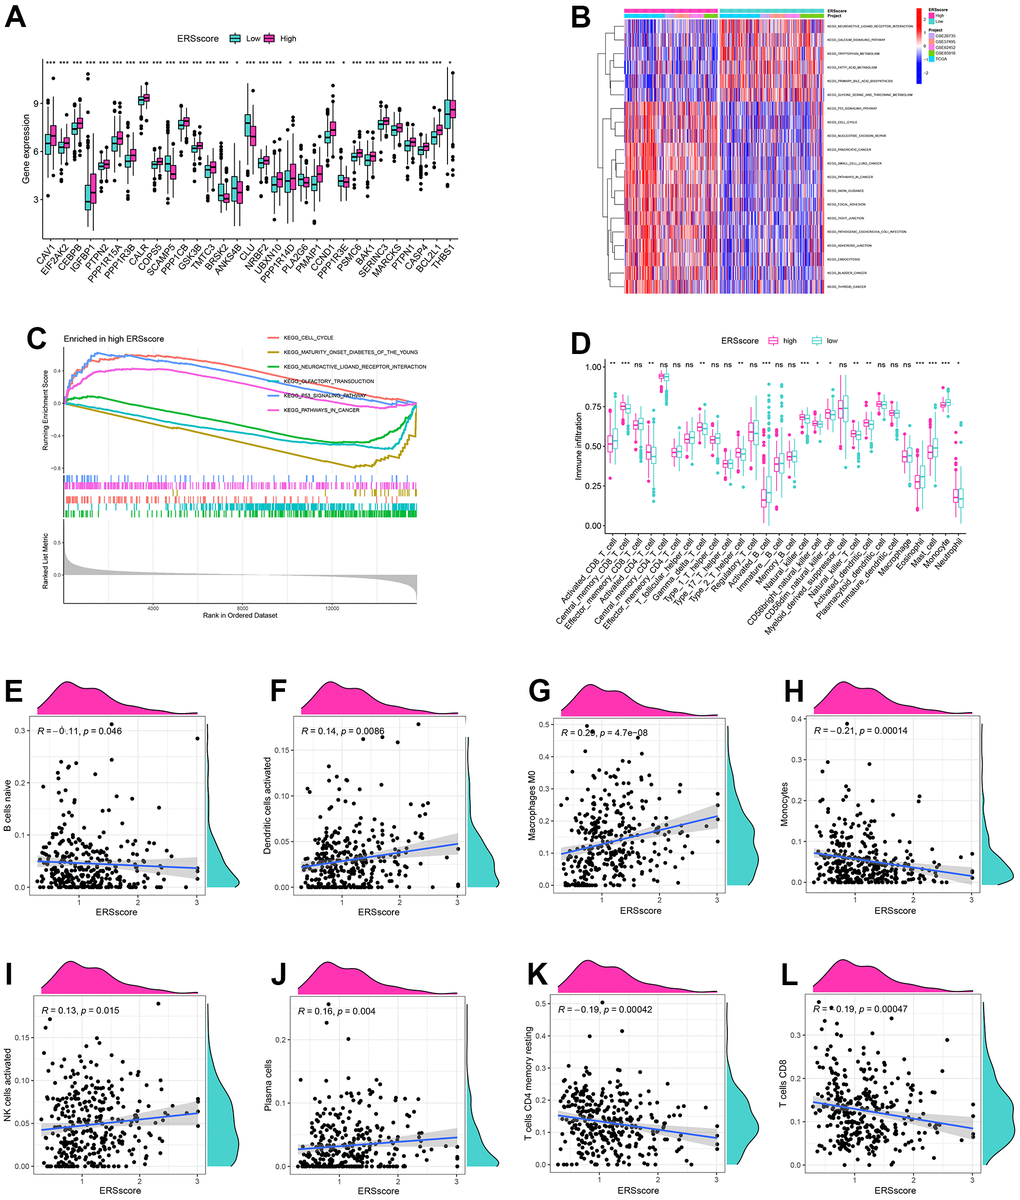
Figure 6. GSVA, GSEA and immune analysis. (A) The expression difference of endoplasmic reticulum stress-related genes between high and low ERS score. (B) GSVA analysis. (C) GSEA analysis. (D) ssGSEA analysis. Correlation of naive B cells (E), activated dendritic cells (F), macrophages M0 (G), monocytes (H), activated NK cells (I), plasma cells (J), memory resting CD4+ T cells (K) and CD8+ T cells (L), and ERS score based around the CIBERSORT algorithm. (*p<0.05; **p<0.01; ***p<0.001).
To identify the relationship of the tumour microenvironment and ERS-related model, ssGSEA and CIBERSORT algorithms were carried out. The ssGSEA found remarkably higher infiltration score in activated B cells, activated CD8+ T cells, mast cells, and monocytes within the low ERS score group. The levels of infiltration of activated CD4+ T cells, activated DC cells, NK cells, neutrophils, and type 2 T helper cells within the high ERS score group were significantly increased (Figure 6D). CIBERSORT algorithm indicated ERS score was remarkably negatively associated with B cells, monocyte, memory resting CD4+ T cells, and CD8+ T cells, but positively associated with DCs, macrophages M0, and NK cells (Figure 6E–6L).
Mutation and drug sensitivity analyses
Previous studies indicated that inactivated mutations in the tumour suppressor genes TP53, SMAD4, and CDKN2A and activated mutations in the proto-oncogene KRAS were closely related to the incidence as well as the bad prognosis in PC [35, 36]. The genetic mutation landscapes between the different ERS score groups were analyzed in this study. Results found KRAS, TP53, SMAD4, and CDKN2A were the top four mutated genes, and the mutation frequency within the high ERS score group was higher (Figure 7A, 7B). In addition, TMB for every sample was computed, and results showed TMB within the high ERS score group was remarkably higher, as well as the ERS score being considerably positively related to TMB (Figure 7C, 7D).
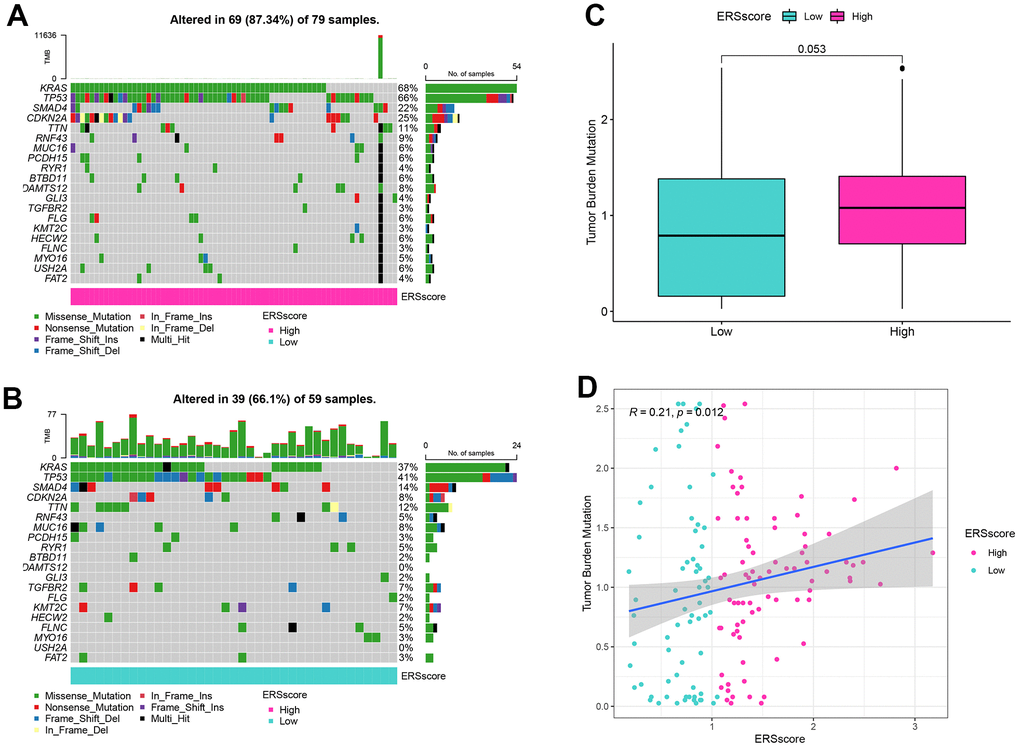
Figure 7. Mutation analysis. (A) Waterfall map of mutation landscape within the high ERS score group. (B) Waterfall map of mutation landscape within the low ERS score group. (C) The tumour mutation burden (TMB) between the different ERS score groups. (D) Correlation of TMB and ERS score.
Drug-assisted therapy, especially chemotherapy, is vital to improving the survival time for PC. However, the effectiveness of drug therapy is challenged by drug resistance that develops before and during treatment. Clarifying each patient's sensitivity to different drug therapies is critical for clinicians to form personalized treatment plans. The relationship of drug sensitivity and ERS-related model was evaluated through the “oncoPredict” package. Results showed that the low ERS score group had a better response to 5-fluorouracil, cisplatin, gemcitabine, irinotecan, KRAS (G12C) inhibitor-12, oxaliplatin, and paclitaxel, while higher ERS score had better response to trametinib (Figure 8A–8H). Utilizing the CellMiner database, we revealed that MET was remarkably negatively related to the sensitivity of paclitaxel and oxaliplatin, and remarkably positively related to trametinib. MUC16 was considerably negatively related to the sensitivity of oxaliplatin, irinotecan, and gemcitabine, and considerably positively related to the sensitivity of erlotinib. KRT7 was considerably negatively related to the sensitivity of oxaliplatin and positively related to the sensitivity of erlotinib (Figure 8I).
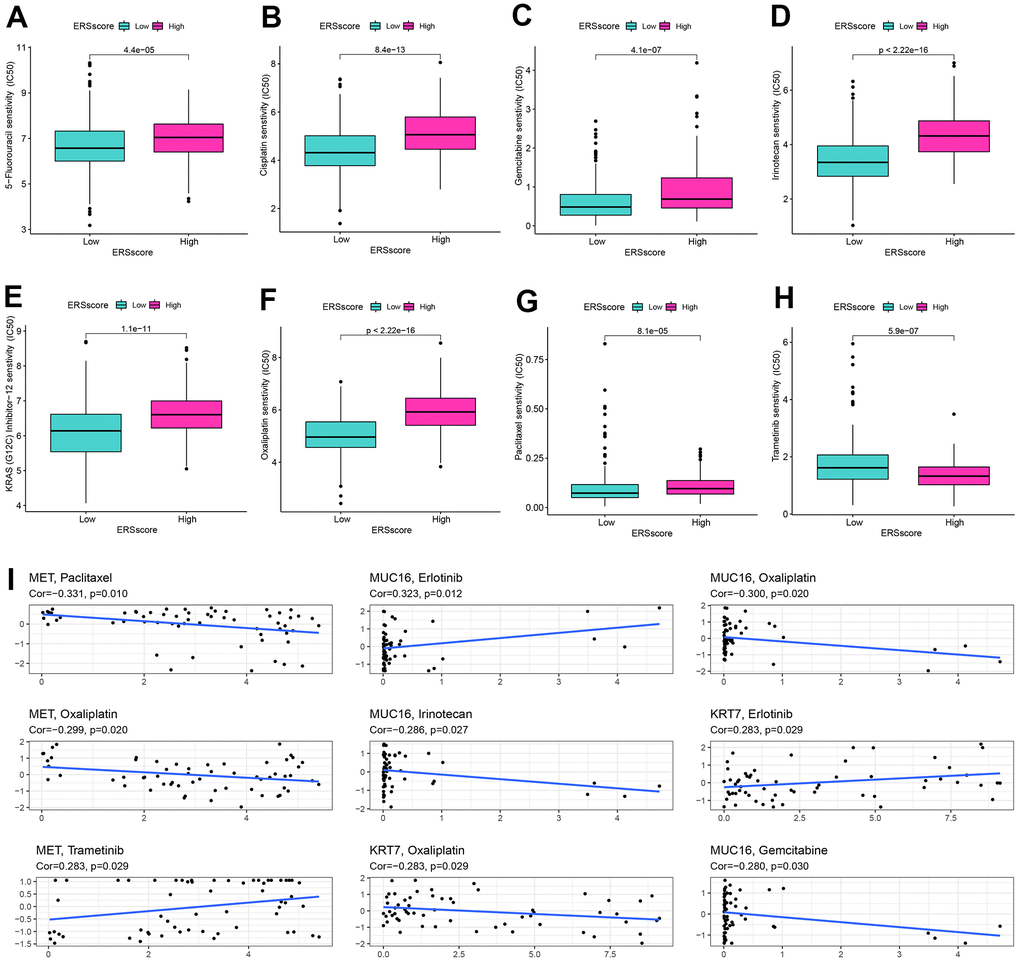
Figure 8. Drug sensitivity analysis. The sensitivity of 5-Fluorouracil (A), cisplatin (B), gemcitabine (C), irinotecan (D), KRAS (G12C) inhibitor-12 (E), oxaliplatin (F), paclitaxel (G), and trametinib (H) between the high and low ERS score groups. (I) Correlation of drug sensitivity and MET, KRT7, and MUC16 expression.
Gene expression validation and distribution exploration
Based on GEPIA database, we found that mRNA expression of MET, KRT7, and MUC16 was remarkably higher in pancreatic tumour than in normal tissues (Figure 9A–9C). We downloaded immunohistochemical images of pancreatic tumour tissue and normal tissue through HPA platform, and found the protein expression of MET, KRT7, and MUC16 in pancreatic tumour were higher than normal tissues (Figure 9D–9F) (Figure 9D is available from the following URL: https://www.proteinatlas.org/ENSG00000105976-MET/tissue/pancreas#img, https://www.proteinatlas.org/ENSG00000105976-MET/pathology/pancreatic+cancer#img; Figure 9E is available from the following URL: https://www.proteinatlas.org/ENSG00000135480-KRT7/tissue/pancreas#img, https://www.proteinatlas.org/ENSG00000135480-KRT7/pathology/pancreatic+cancer#img; Figure 9F is available from the following URL: https://www.proteinatlas.org/ENSG00000181143-MUC16/tissue/pancreas#img, https://www.proteinatlas.org/ENSG00000181143-MUC16/pathology/pancreatic+cancer#img). What’s more, we validated the expression of MET, KRT7, and MUC16 using RT-qPCR through in vivo and in vitro experiments. Compared to HPDE6-C7, MET was significantly higher expressed in PC cell lines BxPC-3, CF-PAC1 (Figure 9G), KRT7 was significantly higher expressed in PC cell lines BxPC-3, CF-PAC1 (Figure 9H), and MUC16 was significantly higher expressed in PC cell lines BxPC-3, CF-PAC1, and Panc-1 (Figure 9I). Compared to pancreatic normal tissues, the expression levels of MET, KRT7, and MUC16 were remarkably higher in pancreatic tumour tissues (Figure 9J–9L).
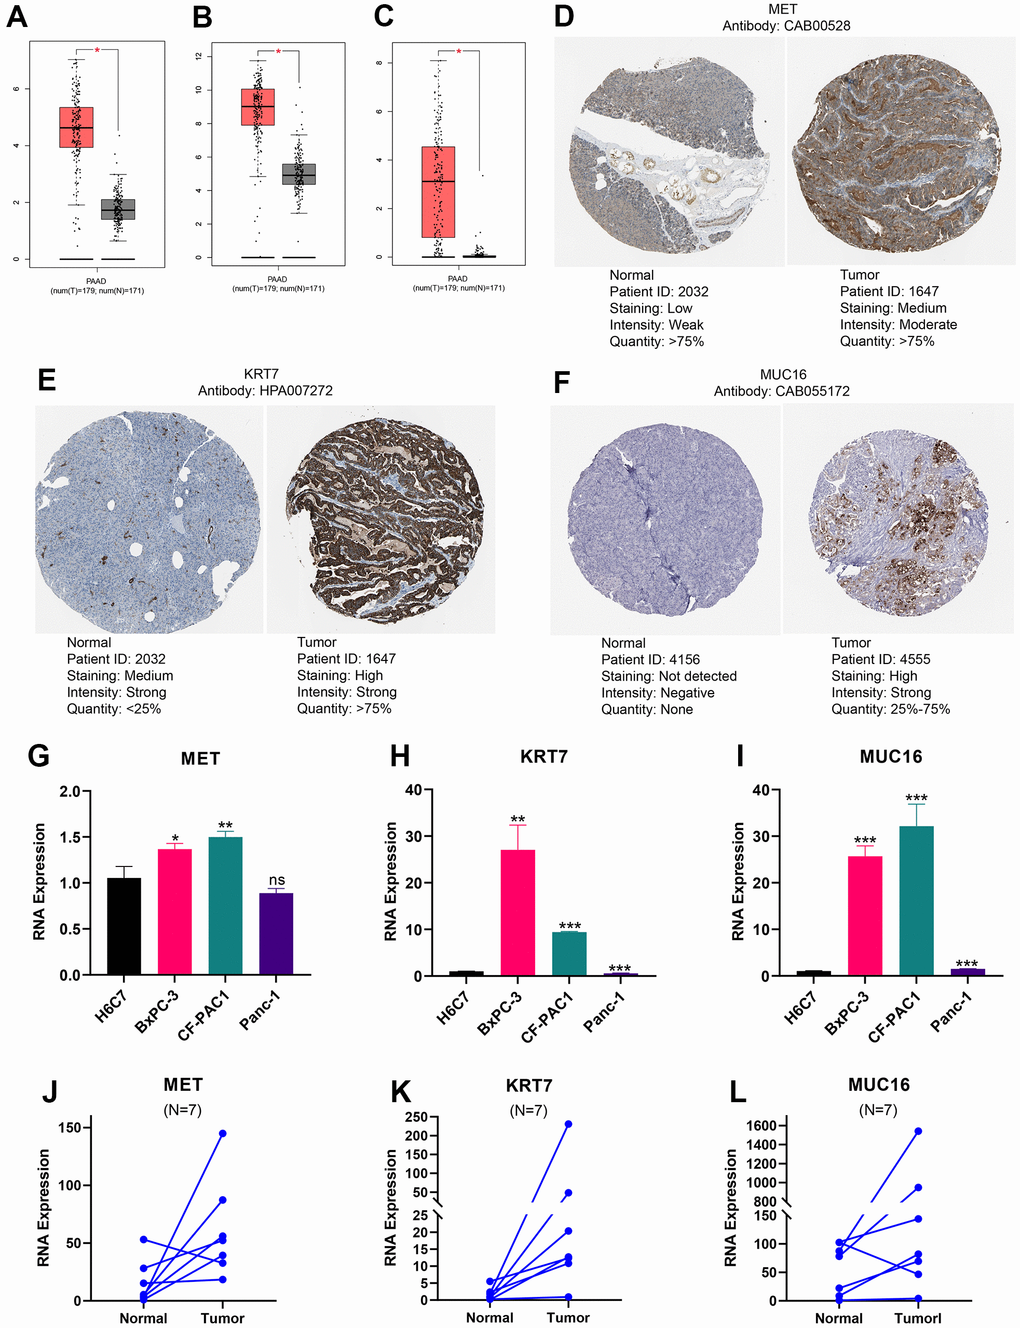
Figure 9. Expression levels of MET, KRT7, and MUC16. The expression of MET (A), KRT7 (B), and MUC16 (C) at RNA level. Immunohistochemical images of MET (D), KRT7 (E), and MUC16 (F). The expression differences of MET (G), KRT7 (H), and MUC16 (I) between pancreatic ductal epithelium and pancreatic cancer cell lines. The expression difference of MET (J), KRT7 (K), and MUC16 (L) between pancreatic tumour and adjacent tissue. (*p<0.05; **p<0.01; ***p<0.001).
We further explored the distribution of gene expression in different cell substructures as well as different cell types. MET was detected in the plasma membrane and cytosol and was predicted to be secreted out of the cell (Figure 10A, the URL is https://www.proteinatlas.org/ENSG00000105976-MET/subcellular). MUC16 was predicted to be secreted out of the cell (Figure 10B, the URL is https://www.proteinatlas.org/ENSG00000181143-MUC16/subcellular). KRT7 was detected in intermediate filaments and the cytosol (Figure 10C, the URL is https://www.proteinatlas.org/ENSG00000135480-KRT7/subcellular). Unlike the gene expression data obtained from conventional tissue RNA-seq, single-cell RNA-seq may offer transcription data from a single cell. The single-cell analysis was performed using the single-cell dataset CAR001160 through TISCH platform. Results revealed that in the tumour microenvironment of PC, malignant, duct, endothelial and stellate cells were the top four cell types with the highest proportion (Figure 10D–10F). Compared to other cell subtypes in the tumour microenvironment, the expression of MET, MUC16, and KRT7 was higher in pancreatic malignant cells (Figure 10G–10L).
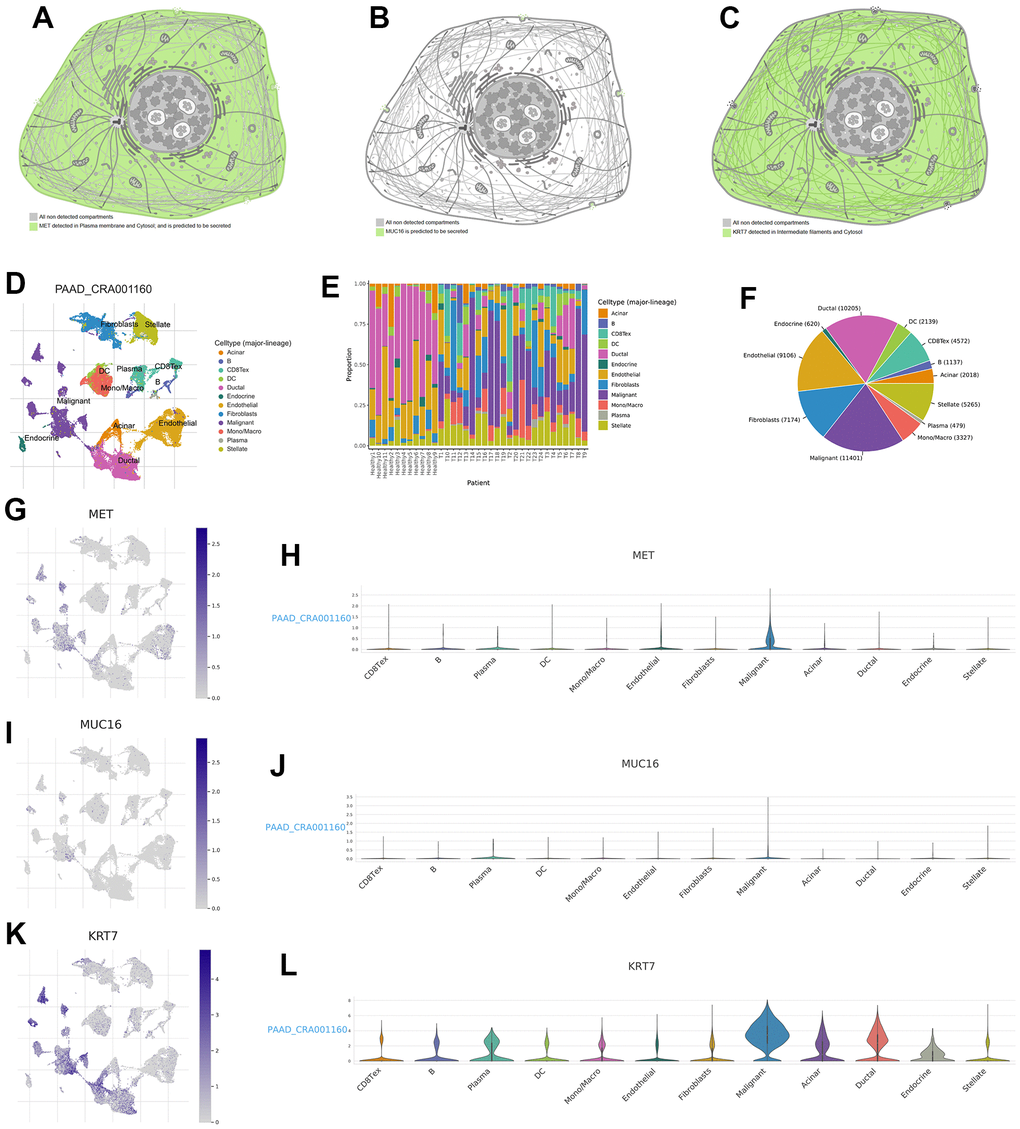
Figure 10. Expression distribution of MET, MUC16, and KRT7 and single-cell analysis. The expression distribution of MET (A), MUC16 (B), and KRT7 (C) in different cell substructures. (D) Annotation of each cell subset. (E) The proportion of each cell subset in each sample. (F) The percentages of each cell in pancreatic tumour microenvironment. (G, H) The distribution and proportion of MET expression within each cell subset. (I, J) The distribution and proportion of MUC16 expression in each cell subset. (K, L) The distribution and proportion of KRT7 expression in each cell subset.
Discussion
PC is an extremely malignant digestive tract tumour with a 5-year survival rate of just 10% [37]. Even though the therapy for malignancies has undergone significant evolution in the last few decades, the prognosis of PC has not been distinctly improved. It is unquestionably a long and difficult task to explore the pathologic process of PC and uncover potential treatment strategies. Tumorigenesis, as a pathophysiological process with extremely complicated mechanisms, involves multi-level reactions and mutation accumulation, which are related to a variety of internal and external factors, such as genetic factors, environmental exposure, dietary habits, and so on. As the largest organelle in eukaryotic cells, endoplasmic reticulum is involved in protein synthesis, folding, and transport [38]. Many adverse factors, such as hypoxia, nutritional deficiency, oxidative stress, oncogene activation, and calcium imbalance, can interfere with the normal protein folding process in endoplasmic reticulum, leading to the aggregation of unfolded or misfolded proteins within the endoplasmic reticulum, thus inducing ERS [39–41]. Relevant studies have shown that ERS is involved in multiple mechanisms of tumorigenesis and progression, including tumour formation and metastasis, angiogenesis, chemotherapy resistance, and immune escape [42–44]. However, majority of ERGs have not been investigated in PC. In this study, we established the ERS-related molecular subtypes as well as a prognostic model for PC.
Based on consensus clustering analysis, all the PC patients were classified into ERGcluster A and B. ERGcluster B with a higher ERS level had a significantly worse prognosis. In malignant tumours, cancer cells are in vigourous activity of proliferation and division, facing more oxygen and nutrient deficiency, DNA damage, and other stress stimuli, which makes cancer cells have a more active ERS level [45]. GSVA analysis showed that compared with ERGcluster A, ERGcluster B was significantly enriched within malignant tumor-related pathways like “cell cycle”, “p53 signaling pathway”, “pancreatic cancer”, etc. Immune escape is one of the most important mechanisms in malignant tumour formation. Tumour cells may escape the recognition of the immune system depending on whether they create “self” markers or have sufficient immunosuppressive ability in their microenvironment so as to survive and grow continuously [46]. Previous studies showed that ERS in tumour cells not only participates in regulating intracellular events such as cell proliferation, but may also be involved in the regulation of extracellular effects such as modulating the tumour immune microenvironment and immune responses [47, 48]. Cubillos-Ruiz et al. [19] found that XBP1, an ERS response factor, can restrain the anti-tumour immune response and promote neoplasm endogenous growth. Study from Liu et al. [49] showed that ERS could cause hepatocellular carcinoma cells to release exosome miR-23a-3p, which mediated macrophages to overexpress programmed death ligand 1, thereby inhibiting the anti-tumor immune function of T cells. A large amount of evidence has confirmed that Tregs, neutrophils, and MDSCs contributed to the establishment of an immunosuppressive tumour microenvironment, which in turn helps tumour cells escape the killing function of the immune system [50–53]. In the current study, ssGSEA analysis revealed considerable variations in pancreatic tumour microenvironment between the different ERS-related patterns. Treg cells, neutrophils, and MDSCs were significantly more infiltrated in ERGcluster B with a more active ERS state. This indirectly indicated that ERS might be related to anti-tumour immunity and involve in the process of tumour cells escaping the killing of immune cells.
The ERS-related prognostic model was further established to quantify the ERS score in each individual patient. ssGSEA indicated Treg cells had significantly higher infiltration scores within the high ERS score group, and higher infiltration of CD8+ T cells and B cells within the low ERS score group. CD8+ T cells can kill tumour cells by secreting large amounts of interferon-γ, tumour necrosis factor α and protease granzyme B. Therefore, CD8+ T cells compete for a very important role in anti-tumour immunity and are considered to be associated with a better prognosis for malignant tumour [54–56]. A large sample study of 12,439 breast cancer patients [57] found that the infiltration of CD8+ T cells in tumour tissue may significantly improve the survival time for breast cancer. The study by Miller et al. [58] found that a higher CD8+ T cell infiltration within the tumour was related to a better prognosis in colon cancer. Wang et al. [59] showed that higher CD8+ T cell infiltration within gastric cancer tissues was related to a improved prognosis. Our study showed CD8+ T cells infiltration levels were significantly higher within the low ERS score group. In vivo, B cells are mainly involved in humoral immune response, immunoglobulin secretion, antigen presentation, and T cell immune regulation [60, 61]. However, unlike CD8+ T cells, the function of B lymphocytes in tumours is controversial. On the one hand, some studies found that the infiltration of CD20+ B lymphocytes in tumour tissues played a negative regulatory role in tumour growth, and was relate to improved prognosis and reduced recurrence rates in ovarian cancer and cervical squamous cell cancer [62–64]. On the other hand, B cells with STAT3 activity were revealed to be associated with tumour angiogenesis, thus determining that B cells with STAT3 activity can mediate tumour progression and may be utilized as potential treatment targets for malignant tumour [65]. Dong et al. [66] found that CD19+ B cells within metastatic ovarian cancer tissues were related to worse survival. Lundgren et al. [67] indicated that incremental infiltrations of CD20+ and CD138+ B cells were related to a worse prognosis for epithelial ovarian carcinoma. The different roles of B cells in anti-tumor response may depend on different B cell subtypes with distinct phenotypes and functions, which still need to be explored in future studies.
The ERS-related prognostic model included three genes: MET, MUC16, and KRT7, which were associated with a poor prognosis for PC. MET, a proto-oncogene, is transcribed and translated to form c-Met protein, which is a transmembrane tyrosine kinase that takes part in the occurrence and development of a variety of malignant tumours [68, 69]. Study from Dai et al. [15] found that calcium disturbances in endoplasmic reticulum could induce the conversion of the precursor Met (Pro-Met) into a more stable functional form of c-Met (P190MetNC), thereby inhibiting ERS-induced apoptosis in hepatocellular carcinoma by maintaining the high activity of PI3K/Akt and MEK/ERK pathways. Li et al. [70] showed that human induced pluripotent stem cell-derived mesenchymal stem cells (iPS-MSCs) can alleviate ERS, inflammation, and apoptosis in the kidneys of high-fat diet-induced obese mice by activating the hepatocyte growth factor (HGF) /c-Met paracrine signaling pathway. MUC16, also known as CA125, is a type I transmembrane glycosylated protein, which is involved in the growth, proliferation, apoptosis inhibition, chemotherapy resistance, metabolic reprogramming, and immune evasion of tumour cells [71, 72]. MUC16 was detected to be highly expressed in various tumours, like PC [73], ovarian carcinoma [74] and cervical cancer [75], etc. Liang et al. [76] showed that high expression of CA125 in serum was related to a worse prognosis of pancreatic cancer. Our study showed that MUC16 was significantly higher expressed in pancreatic tumour than normal pancreatic tissues and was related to a worse prognosis. Keratin 7 (KRT7), as a member of the keratin gene family, is abnormally expressed in different types of malignant tumours, such as esophageal squamous cell carcinoma [77], colorectal cancer [78] and ovarian cancer [79]. The current study found KRT7 was remarkably overexpressed in pancreatic tumours and related to a worse prognosis, suggesting KRT7 might function as a possible therapeutic target for PC.
Chemotherapy is the main treatment for postoperative and advanced PC patients. At present, the first-line chemotherapy regimen for PC is FOLFIRINOX (fluorouracil, oxaliplatin, irinotecan, and leucovorin) or gemcitabine combined with nab-paclitaxel [5]. However, the response rate of pancreatic cancer patients to chemotherapy is not high, and chemoresistance is often the cause of chemotherapy failure. ERS is associated with sensitivity to drug therapy for cancer. Wang et al. [80] found that apatinib could induce ERS-mediated apoptosis and autophagy through the IRE-1α/AKT/mTOR pathway in esophageal squamous cancer, and make tumour cells more sensitive to paclitaxel. Huang et al. [81] showed that reticulocalbin-1 gene knockout can promote ERS-induced apoptosis and make nasopharyngeal carcinoma cells more sensitive to doxorubicin. We study revealed that patients with a low ERS score had a better response to 5-fluorouracil, gemcitabine, irinotecan, oxaliplatin, and paclitaxel, while the high ERS score group had a better response to the targeted drug trametinib. These are instructive for the individualization of patients with PC.
In the current study, we first clarified that ERGs compete for important roles in the carcinogenesis and progression of PC through comprehensive bioinformatics analysis and in vivo and in vitro experiments. However, there are also some limitations that could be improved in future studies. Firstly, survival information for PC was acquired from online databases. Although we used different databases to validate our prognostic model, prospective large clinical samples are still necessary to further confirm the reliability of the model. Secondly, we utilized in vivo and in vitro experiments to validate the expression of the genes in our panel, but the specific mechanisms of ERS in inducing PC development and interfering with the tumour immune microenvironment still need to be investigated in more in-depth experiments in the future.
Conclusions
We first evaluated the genetic variations of ERGs in pan-cancer, and constructed the ERS-related molecular subtypes and prognostic model for PC by extensive bioinformatics analysis and in vitro and in vivo experiments, which revealed ERS was closely associated with the prognosis, tumour immune microenvironment, genomic mutation, and drug sensitivity of PC. These results will contribute to the further study of molecular mechanisms and novel therapeutic strategies for PC in the future.
Author Contributions
BZ, XC, and ZW conceived and drafted the study. BZ and XC were responsible for data download and analysis. BZ and ZW conducted the experiments in vivo and in vitro. FG, XZ, and BH accomplished the manuscript. SM, SX, and DS revised the manuscript. All authors approved the submitted version.
Conflicts of Interest
The authors declare no conflicts of interest.
Ethical Statement and Consent
The study was approved by the Ethical Review Committee of the Institutional Review Board of the First Affiliated Hospital of Dalian Medical University. Informed consent was obtained from the patients participating in this study.
Funding
This study was not supported by any fund.
References
- 1. Yuan Q, Ren J, Li L, Li S, Xiang K, Shang D. Development and validation of a novel N6-methyladenosine (m6A)-related multi- long non-coding RNA (lncRNA) prognostic signature in pancreatic adenocarcinoma. Bioengineered. 2021; 12:2432–48. https://doi.org/10.1080/21655979.2021.1933868 [PubMed]
- 2. Siegel RL, Miller KD, Fuchs HE, Jemal A. Cancer statistics, 2022. CA Cancer J Clin. 2022; 72:7–33. https://doi.org/10.3322/caac.21708 [PubMed]
- 3. Rahib L, Smith BD, Aizenberg R, Rosenzweig AB, Fleshman JM, Matrisian LM. Projecting cancer incidence and deaths to 2030: the unexpected burden of thyroid, liver, and pancreas cancers in the United States. Cancer Res. 2014; 74:2913–21. https://doi.org/10.1158/0008-5472.CAN-14-0155 [PubMed]
- 4. Strobel O, Neoptolemos J, Jäger D, Büchler MW. Optimizing the outcomes of pancreatic cancer surgery. Nat Rev Clin Oncol. 2019; 16:11–26. https://doi.org/10.1038/s41571-018-0112-1 [PubMed]
- 5. Tempero MA, Malafa MP, Al-Hawary M, Behrman SW, Benson AB, Cardin DB, Chiorean EG, Chung V, Czito B, Del Chiaro M, Dillhoff M, Donahue TR, Dotan E, et al. Pancreatic Adenocarcinoma, Version 2.2021, NCCN Clinical Practice Guidelines in Oncology. J Natl Compr Canc Netw. 2021; 19:439–57. https://doi.org/10.6004/jnccn.2021.0017 [PubMed]
- 6. Keating GM. Sorafenib: A Review in Hepatocellular Carcinoma. Target Oncol. 2017; 12:243–53. https://doi.org/10.1007/s11523-017-0484-7 [PubMed]
- 7. Topalian SL, Hodi FS, Brahmer JR, Gettinger SN, Smith DC, McDermott DF, Powderly JD, Carvajal RD, Sosman JA, Atkins MB, Leming PD, Spigel DR, Antonia SJ, et al. Safety, activity, and immune correlates of anti-PD-1 antibody in cancer. N Engl J Med. 2012; 366:2443–54. https://doi.org/10.1056/NEJMoa1200690 [PubMed]
- 8. Haber PK, Castet F, Torres-Martin M, Andreu-Oller C, Puigvehí M, Miho M, Radu P, Dufour JF, Verslype C, Zimpel C, Marquardt JU, Galle PR, Vogel A, et al. Molecular Markers of Response to Anti-PD1 Therapy in Advanced Hepatocellular Carcinoma. Gastroenterology. 2023; 164:72–88.e18. https://doi.org/10.1053/j.gastro.2022.09.005 [PubMed]
- 9. Topalian SL, Sznol M, McDermott DF, Kluger HM, Carvajal RD, Sharfman WH, Brahmer JR, Lawrence DP, Atkins MB, Powderly JD, Leming PD, Lipson EJ, Puzanov I, et al. Survival, durable tumor remission, and long-term safety in patients with advanced melanoma receiving nivolumab. J Clin Oncol. 2014; 32:1020–30. https://doi.org/10.1200/JCO.2013.53.0105 [PubMed]
- 10. Ribas A, Wolchok JD. Cancer immunotherapy using checkpoint blockade. Science. 2018; 359:1350–5. https://doi.org/10.1126/science.aar4060 [PubMed]
- 11. Hong D, Rasco D, Veeder M, Luke JJ, Chandler J, Balmanoukian A, George TJ, Munster P, Berlin JD, Gutierrez M, Mita A, Wakelee H, Samakoglu S, et al. A Phase 1b/2 Study of the Bruton Tyrosine Kinase Inhibitor Ibrutinib and the PD-L1 Inhibitor Durvalumab in Patients with Pretreated Solid Tumors. Oncology. 2019; 97:102–11. https://doi.org/10.1159/000500571 [PubMed]
- 12. Chen X, Cubillos-Ruiz JR. Endoplasmic reticulum stress signals in the tumour and its microenvironment. Nat Rev Cancer. 2021; 21:71–88. https://doi.org/10.1038/s41568-020-00312-2 [PubMed]
- 13. Urra H, Dufey E, Avril T, Chevet E, Hetz C. Endoplasmic Reticulum Stress and the Hallmarks of Cancer. Trends Cancer. 2016; 2:252–62. https://doi.org/10.1016/j.trecan.2016.03.007 [PubMed]
- 14. Hetz C. The unfolded protein response: controlling cell fate decisions under ER stress and beyond. Nat Rev Mol Cell Biol. 2012; 13:89–102. https://doi.org/10.1038/nrm3270 [PubMed]
- 15. Dai R, Li J, Fu J, Chen Y, Yu L, Zhao X, Qian Y, Zhang H, Chen H, Ren Y, Su B, Luo T, Zhu J, Wang H. Disturbance of Ca2+ homeostasis converts pro-Met into non-canonical tyrosine kinase p190MetNC in response to endoplasmic reticulum stress in MHCC97 cells. J Biol Chem. 2012; 287:14586–97. https://doi.org/10.1074/jbc.M111.333435 [PubMed]
- 16. Wang S, Kaufman RJ. The impact of the unfolded protein response on human disease. J Cell Biol. 2012; 197:857–67. https://doi.org/10.1083/jcb.201110131 [PubMed]
- 17. Oakes SA. Endoplasmic Reticulum Stress Signaling in Cancer Cells. Am J Pathol. 2020; 190:934–46. https://doi.org/10.1016/j.ajpath.2020.01.010 [PubMed]
- 18. Pereira ER, Liao N, Neale GA, Hendershot LM. Transcriptional and post-transcriptional regulation of proangiogenic factors by the unfolded protein response. PLoS One. 2010; 5:e12521. https://doi.org/10.1371/journal.pone.0012521 [PubMed]
- 19. Cubillos-Ruiz JR, Silberman PC, Rutkowski MR, Chopra S, Perales-Puchalt A, Song M, Zhang S, Bettigole SE, Gupta D, Holcomb K, Ellenson LH, Caputo T, Lee AH, et al. ER Stress Sensor XBP1 Controls Anti-tumor Immunity by Disrupting Dendritic Cell Homeostasis. Cell. 2015; 161:1527–38. https://doi.org/10.1016/j.cell.2015.05.025 [PubMed]
- 20. Avril T, Vauléon E, Chevet E. Endoplasmic reticulum stress signaling and chemotherapy resistance in solid cancers. Oncogenesis. 2017; 6:e373. https://doi.org/10.1038/oncsis.2017.72 [PubMed]
- 21. Salaroglio IC, Panada E, Moiso E, Buondonno I, Provero P, Rubinstein M, Kopecka J, Riganti C. PERK induces resistance to cell death elicited by endoplasmic reticulum stress and chemotherapy. Mol Cancer. 2017; 16:91. https://doi.org/10.1186/s12943-017-0657-0 [PubMed]
- 22. Leek JT, Johnson WE, Parker HS, Jaffe AE, Storey JD. The sva package for removing batch effects and other unwanted variation in high-throughput experiments. Bioinformatics. 2012; 28:882–3. https://doi.org/10.1093/bioinformatics/bts034 [PubMed]
- 23. Chi H, Yang J, Peng G, Zhang J, Song G, Xie X, Xia Z, Liu J, Tian G. Circadian rhythm-related genes index: A predictor for HNSCC prognosis, immunotherapy efficacy, and chemosensitivity. Front Immunol. 2023; 14:1091218. https://doi.org/10.3389/fimmu.2023.1091218 [PubMed]
- 24. Liberzon A, Birger C, Thorvaldsdóttir H, Ghandi M, Mesirov JP, Tamayo P. The Molecular Signatures Database (MSigDB) hallmark gene set collection. Cell Syst. 2015; 1:417–25. https://doi.org/10.1016/j.cels.2015.12.004 [PubMed]
- 25. Zhao S, Zhang X, Gao F, Chi H, Zhang J, Xia Z, Cheng C, Liu J. Identification of copper metabolism-related subtypes and establishment of the prognostic model in ovarian cancer. Front Endocrinol (Lausanne). 2023; 14:1145797. https://doi.org/10.3389/fendo.2023.1145797 [PubMed]
- 26. Chi H, Zhao S, Yang J, Gao X, Peng G, Zhang J, Xie X, Song G, Xu K, Xia Z, Chen S, Zhao J. T-cell exhaustion signatures characterize the immune landscape and predict HCC prognosis via integrating single-cell RNA-seq and bulk RNA-sequencing. Front Immunol. 2023; 14:1137025. https://doi.org/10.3389/fimmu.2023.1137025 [PubMed]
- 27. Newman AM, Liu CL, Green MR, Gentles AJ, Feng W, Xu Y, Hoang CD, Diehn M, Alizadeh AA. Robust enumeration of cell subsets from tissue expression profiles. Nat Methods. 2015; 12:453–7. https://doi.org/10.1038/nmeth.3337 [PubMed]
- 28. Lv J, Zhu Y, Ji A, Zhang Q, Liao G. Mining TCGA database for tumor mutation burden and their clinical significance in bladder cancer. Biosci Rep. 2020; 40:40. https://doi.org/10.1042/BSR20194337 [PubMed]
- 29. Maeser D, Gruener RF, Huang RS. oncoPredict: an R package for predicting in vivo or cancer patient drug response and biomarkers from cell line screening data. Brief Bioinform. 2021; 22:22. https://doi.org/10.1093/bib/bbab260 [PubMed]
- 30. Shankavaram UT, Varma S, Kane D, Sunshine M, Chary KK, Reinhold WC, Pommier Y, Weinstein JN. CellMiner: a relational database and query tool for the NCI-60 cancer cell lines. BMC Genomics. 2009; 10:277. https://doi.org/10.1186/1471-2164-10-277 [PubMed]
- 31. Tang Z, Li C, Kang B, Gao G, Li C, Zhang Z. GEPIA: a web server for cancer and normal gene expression profiling and interactive analyses. Nucleic Acids Res. 2017; 45:W98–102. https://doi.org/10.1093/nar/gkx247 [PubMed]
- 32. Pontén F, Schwenk JM, Asplund A, Edqvist PH. The Human Protein Atlas as a proteomic resource for biomarker discovery. J Intern Med. 2011; 270:428–46. https://doi.org/10.1111/j.1365-2796.2011.02427.x [PubMed]
- 33. Sun D, Wang J, Han Y, Dong X, Ge J, Zheng R, Shi X, Wang B, Li Z, Ren P, Sun L, Yan Y, Zhang P, et al. TISCH: a comprehensive web resource enabling interactive single-cell transcriptome visualization of tumor microenvironment. Nucleic Acids Res. 2021; 49:D1420–30. https://doi.org/10.1093/nar/gkaa1020 [PubMed]
- 34. Zhao S, Chi H, Yang Q, Chen S, Wu C, Lai G, Xu K, Su K, Luo H, Peng G, Xia Z, Cheng C, Lu P. Identification and validation of neurotrophic factor-related gene signatures in glioblastoma and Parkinson’s disease. Front Immunol. 2023; 14:1090040. https://doi.org/10.3389/fimmu.2023.1090040 [PubMed]
- 35. Jones S, Zhang X, Parsons DW, Lin JC, Leary RJ, Angenendt P, Mankoo P, Carter H, Kamiyama H, Jimeno A, Hong SM, Fu B, Lin MT, et al. Core signaling pathways in human pancreatic cancers revealed by global genomic analyses. Science. 2008; 321:1801–6. https://doi.org/10.1126/science.1164368 [PubMed]
- 36. Steele CW, Karim SA, Leach JDG, Bailey P, Upstill-Goddard R, Rishi L, Foth M, Bryson S, McDaid K, Wilson Z, Eberlein C, Candido JB, Clarke M, et al. CXCR2 Inhibition Profoundly Suppresses Metastases and Augments Immunotherapy in Pancreatic Ductal Adenocarcinoma. Cancer Cell. 2016; 29:832–45. https://doi.org/10.1016/j.ccell.2016.04.014 [PubMed]
- 37. Ansari D, Tingstedt B, Andersson B, Holmquist F, Sturesson C, Williamsson C, Sasor A, Borg D, Bauden M, Andersson R. Pancreatic cancer: yesterday, today and tomorrow. Future Oncol. 2016; 12:1929–46. https://doi.org/10.2217/fon-2016-0010 [PubMed]
- 38. Fagone P, Jackowski S. Membrane phospholipid synthesis and endoplasmic reticulum function. J Lipid Res. 2009 (Suppl); 50:S311–6. https://doi.org/10.1194/jlr.R800049-JLR200 [PubMed]
- 39. He J, Li G, Liu X, Ma L, Zhang P, Zhang J, Zheng S, Wang J, Liu J. Diagnostic and Prognostic Values of MANF Expression in Hepatocellular Carcinoma. BioMed Res Int. 2020; 2020:1936385. https://doi.org/10.1155/2020/1936385 [PubMed]
- 40. Yang C, Wei Y, Li W, Wei J, Chen G, Xu M, Liu G. Prognostic Risk Signature and Comprehensive Analyses of Endoplasmic Reticulum Stress-Related Genes in Lung Adenocarcinoma. J Immunol Res. 2022; 2022:6567916. https://doi.org/10.1155/2022/6567916 [PubMed]
- 41. Ma Y, Hendershot LM. ER chaperone functions during normal and stress conditions. J Chem Neuroanat. 2004; 28:51–65. https://doi.org/10.1016/j.jchemneu.2003.08.007 [PubMed]
- 42. Yao X, Tu Y, Xu Y, Guo Y, Yao F, Zhang X. Endoplasmic reticulum stress confers 5-fluorouracil resistance in breast cancer cell via the GRP78/OCT4/lncRNA MIAT/AKT pathway. Am J Cancer Res. 2020; 10:838–55. [PubMed]
- 43. Pommier A, Anaparthy N, Memos N, Kelley ZL, Gouronnec A, Yan R, Auffray C, Albrengues J, Egeblad M, Iacobuzio-Donahue CA, Lyons SK, Fearon DT. Unresolved endoplasmic reticulum stress engenders immune-resistant, latent pancreatic cancer metastases. Science. 2018; 360:360. https://doi.org/10.1126/science.aao4908 [PubMed]
- 44. Wadgaonkar P, Chen F. Connections between endoplasmic reticulum stress-associated unfolded protein response, mitochondria, and autophagy in arsenic-induced carcinogenesis. Semin Cancer Biol. 2021; 76:258–66. https://doi.org/10.1016/j.semcancer.2021.04.004 [PubMed]
- 45. Huang R, Li G, Wang K, Wang Z, Zeng F, Hu H, Jiang T. Comprehensive Analysis of the Clinical and Biological Significances of Endoplasmic Reticulum Stress in Diffuse Gliomas. Front Cell Dev Biol. 2021; 9:619396. https://doi.org/10.3389/fcell.2021.619396 [PubMed]
- 46. Ramirez MU, Hernandez SR, Soto-Pantoja DR, Cook KL. Endoplasmic Reticulum Stress Pathway, the Unfolded Protein Response, Modulates Immune Function in the Tumor Microenvironment to Impact Tumor Progression and Therapeutic Response. Int J Mol Sci. 2019; 21:21. https://doi.org/10.3390/ijms21010169 [PubMed]
- 47. Cubillos-Ruiz JR, Bettigole SE, Glimcher LH. Tumorigenic and Immunosuppressive Effects of Endoplasmic Reticulum Stress in Cancer. Cell. 2017; 168:692–706. https://doi.org/10.1016/j.cell.2016.12.004 [PubMed]
- 48. Lee BR, Chang SY, Hong EH, Kwon BE, Kim HM, Kim YJ, Lee J, Cho HJ, Cheon JH, Ko HJ. Elevated endoplasmic reticulum stress reinforced immunosuppression in the tumor microenvironment via myeloid-derived suppressor cells. Oncotarget. 2014; 5:12331–45. https://doi.org/10.18632/oncotarget.2589 [PubMed]
- 49. Liu J, Fan L, Yu H, Zhang J, He Y, Feng D, Wang F, Li X, Liu Q, Li Y, Guo Z, Gao B, Wei W, et al. Endoplasmic Reticulum Stress Causes Liver Cancer Cells to Release Exosomal miR-23a-3p and Up-regulate Programmed Death Ligand 1 Expression in Macrophages. Hepatology. 2019; 70:241–58. https://doi.org/10.1002/hep.30607 [PubMed]
- 50. Mougiakakos D, Johansson CC, Trocme E, All-Ericsson C, Economou MA, Larsson O, Seregard S, Kiessling R. Intratumoral forkhead box P3-positive regulatory T cells predict poor survival in cyclooxygenase-2-positive uveal melanoma. Cancer. 2010; 116:2224–33. https://doi.org/10.1002/cncr.24999 [PubMed]
- 51. Ostrand-Rosenberg S, Sinha P. Myeloid-derived suppressor cells: linking inflammation and cancer. J Immunol. 2009; 182:4499–506. https://doi.org/10.4049/jimmunol.0802740 [PubMed]
- 52. DeNardo DG, Andreu P, Coussens LM. Interactions between lymphocytes and myeloid cells regulate pro- versus anti-tumor immunity. Cancer Metastasis Rev. 2010; 29:309–16. https://doi.org/10.1007/s10555-010-9223-6 [PubMed]
- 53. Gabrilovich DI. Myeloid-Derived Suppressor Cells. Cancer Immunol Res. 2017; 5:3–8. https://doi.org/10.1158/2326-6066.CIR-16-0297 [PubMed]
- 54. Wang H, Fu Y, Da BB, Xiong G. Single-Cell Sequencing Identifies the Heterogeneity of CD8+ T Cells and Novel Biomarker Genes in Hepatocellular Carcinoma. J Healthc Eng. 2022; 2022:8256314. https://doi.org/10.1155/2022/8256314 [PubMed]
- 55. St Paul M, Ohashi PS. The Roles of CD8+ T Cell Subsets in Antitumor Immunity. Trends Cell Biol. 2020; 30:695–704. https://doi.org/10.1016/j.tcb.2020.06.003 [PubMed]
- 56. Philip M, Schietinger A. CD8+ T cell differentiation and dysfunction in cancer. Nat Rev Immunol. 2022; 22:209–23. https://doi.org/10.1038/s41577-021-00574-3 [PubMed]
- 57. Ali HR, Provenzano E, Dawson SJ, Blows FM, Liu B, Shah M, Earl HM, Poole CJ, Hiller L, Dunn JA, Bowden SJ, Twelves C, Bartlett JM, et al. Association between CD8+ T-cell infiltration and breast cancer survival in 12,439 patients. Ann Oncol. 2014; 25:1536–43. https://doi.org/10.1093/annonc/mdu191 [PubMed]
- 58. Miller TJ, Anyaegbu CC, Lee-Pullen TF, Spalding LJ, Platell CF, McCoy MJ. PD-L1+ dendritic cells in the tumor microenvironment correlate with good prognosis and CD8+ T cell infiltration in colon cancer. Cancer Sci. 2021; 112:1173–83. https://doi.org/10.1111/cas.14781 [PubMed]
- 59. Wang Y, Zhu C, Song W, Li J, Zhao G, Cao H. PD-L1 Expression and CD8+ T Cell Infiltration Predict a Favorable Prognosis in Advanced Gastric Cancer. J Immunol Res. 2018; 2018:4180517. https://doi.org/10.1155/2018/4180517 [PubMed]
- 60. Wu H, Chen C, Gu L, Li J, Yue Y, Lyu M, Cui Y, Zhang X, Liu Y, Zhu H, Liao X, Zhang T, Sun F, Hu W. B cell deficiency promotes the initiation and progression of lung cancer. Front Oncol. 2022; 12:1006477. https://doi.org/10.3389/fonc.2022.1006477 [PubMed]
- 61. Tokunaga R, Naseem M, Lo JH, Battaglin F, Soni S, Puccini A, Berger MD, Zhang W, Baba H, Lenz HJ. B cell and B cell-related pathways for novel cancer treatments. Cancer Treat Rev. 2019; 73:10–9. https://doi.org/10.1016/j.ctrv.2018.12.001 [PubMed]
- 62. Nielsen JS, Sahota RA, Milne K, Kost SE, Nesslinger NJ, Watson PH, Nelson BH. CD20+ tumor-infiltrating lymphocytes have an atypical CD27- memory phenotype and together with CD8+ T cells promote favorable prognosis in ovarian cancer. Clin Cancer Res. 2012; 18:3281–92. https://doi.org/10.1158/1078-0432.CCR-12-0234 [PubMed]
- 63. Al-Shibli KI, Donnem T, Al-Saad S, Persson M, Bremnes RM, Busund LT. Prognostic effect of epithelial and stromal lymphocyte infiltration in non-small cell lung cancer. Clin Cancer Res. 2008; 14:5220–7. https://doi.org/10.1158/1078-0432.CCR-08-0133 [PubMed]
- 64. Nedergaard BS, Ladekarl M, Nyengaard JR, Nielsen K. A comparative study of the cellular immune response in patients with stage IB cervical squamous cell carcinoma. Low numbers of several immune cell subtypes are strongly associated with relapse of disease within 5 years. Gynecol Oncol. 2008; 108:106–11. https://doi.org/10.1016/j.ygyno.2007.08.089 [PubMed]
- 65. Yang C, Lee H, Pal S, Jove V, Deng J, Zhang W, Hoon DS, Wakabayashi M, Forman S, Yu H. B cells promote tumor progression via STAT3 regulated-angiogenesis. PLoS One. 2013; 8:e64159. https://doi.org/10.1371/journal.pone.0064159 [PubMed]
- 66. Dong HP, Elstrand MB, Holth A, Silins I, Berner A, Trope CG, Davidson B, Risberg B. NK- and B-cell infiltration correlates with worse outcome in metastatic ovarian carcinoma. Am J Clin Pathol. 2006; 125:451–8. https://doi.org/10.1309/15B66DQMFYYM78CJ [PubMed]
- 67. Lundgren S, Berntsson J, Nodin B, Micke P, Jirström K. Prognostic impact of tumour-associated B cells and plasma cells in epithelial ovarian cancer. J Ovarian Res. 2016; 9:21. https://doi.org/10.1186/s13048-016-0232-0 [PubMed]
- 68. Li C, Wu JJ, Hynes M, Dosch J, Sarkar B, Welling TH, Pasca di Magliano M, Simeone DM. c-Met is a marker of pancreatic cancer stem cells and therapeutic target. Gastroenterology. 2011; 141:2218–27.e5. https://doi.org/10.1053/j.gastro.2011.08.009 [PubMed]
- 69. Yang X, Liao HY, Zhang HH. Roles of MET in human cancer. Clin Chim Acta. 2022; 525:69–83. https://doi.org/10.1016/j.cca.2021.12.017 [PubMed]
- 70. Li B, Leung JCK, Chan LYY, Yiu WH, Li Y, Lok SWY, Liu WH, Chan KW, Tse HF, Lai KN, Tang SCW. Amelioration of Endoplasmic Reticulum Stress by Mesenchymal Stem Cells via Hepatocyte Growth Factor/c-Met Signaling in Obesity-Associated Kidney Injury. Stem Cells Transl Med. 2019; 8:898–910. https://doi.org/10.1002/sctm.18-0265 [PubMed]
- 71. Marimuthu S, Lakshmanan I, Muniyan S, Gautam SK, Nimmakayala RK, Rauth S, Atri P, Shah A, Bhyravbhatla N, Mallya K, Grandgenett PM, Hollingsworth MA, Datta K, et al. MUC16 Promotes Liver Metastasis of Pancreatic Ductal Adenocarcinoma by Upregulating NRP2-Associated Cell Adhesion. Mol Cancer Res. 2022; 20:1208–21. https://doi.org/10.1158/1541-7786.MCR-21-0888 [PubMed]
- 72. Lee DH, Choi S, Park Y, Jin HS. Mucin1 and Mucin16: Therapeutic Targets for Cancer Therapy. Pharmaceuticals (Basel). 2021; 14:14. https://doi.org/10.3390/ph14101053 [PubMed]
- 73. Haridas D, Chakraborty S, Ponnusamy MP, Lakshmanan I, Rachagani S, Cruz E, Kumar S, Das S, Lele SM, Anderson JM, Wittel UA, Hollingsworth MA, Batra SK. Pathobiological implications of MUC16 expression in pancreatic cancer. PLoS One. 2011; 6:e26839. https://doi.org/10.1371/journal.pone.0026839 [PubMed]
- 74. Aithal A, Rauth S, Kshirsagar P, Shah A, Lakshmanan I, Junker WM, Jain M, Ponnusamy MP, Batra SK. MUC16 as a novel target for cancer therapy. Expert Opin Ther Targets. 2018; 22:675–86. https://doi.org/10.1080/14728222.2018.1498845 [PubMed]
- 75. Shen H, Guo M, Wang L, Cui X. MUC16 facilitates cervical cancer progression via JAK2/STAT3 phosphorylation-mediated cyclooxygenase-2 expression. Genes Genomics. 2020; 42:127–33. https://doi.org/10.1007/s13258-019-00885-9 [PubMed]
- 76. Liang C, Qin Y, Zhang B, Ji S, Shi S, Xu W, Liu J, Xiang J, Liang D, Hu Q, Ni Q, Xu J, Yu X. Oncogenic KRAS Targets MUC16/CA125 in Pancreatic Ductal Adenocarcinoma. Mol Cancer Res. 2017; 15:201–12. https://doi.org/10.1158/1541-7786.MCR-16-0296 [PubMed]
- 77. Oue N, Noguchi T, Anami K, Kitano S, Sakamoto N, Sentani K, Uraoka N, Aoyagi K, Yoshida T, Sasaki H, Yasui W. Cytokeratin 7 is a predictive marker for survival in patients with esophageal squamous cell carcinoma. Ann Surg Oncol. 2012; 19:1902–10. https://doi.org/10.1245/s10434-011-2175-4 [PubMed]
- 78. Harbaum L, Pollheimer MJ, Kornprat P, Lindtner RA, Schlemmer A, Rehak P, Langner C. Keratin 7 expression in colorectal cancer—freak of nature or significant finding? Histopathology. 2011; 59:225–34. https://doi.org/10.1111/j.1365-2559.2011.03694.x [PubMed]
- 79. Communal L, Roy N, Cahuzac M, Rahimi K, Köbel M, Provencher DM, Mes-Masson AM. A Keratin 7 and E-Cadherin Signature Is Highly Predictive of Tubo-Ovarian High-Grade Serous Carcinoma Prognosis. Int J Mol Sci. 2021; 22:22. https://doi.org/10.3390/ijms22105325 [PubMed]
- 80. Wang YM, Xu X, Tang J, Sun ZY, Fu YJ, Zhao XJ, Ma XM, Ye Q. Apatinib induces endoplasmic reticulum stress-mediated apoptosis and autophagy and potentiates cell sensitivity to paclitaxel via the IRE-1α-AKT-mTOR pathway in esophageal squamous cell carcinoma. Cell Biosci. 2021; 11:124. https://doi.org/10.1186/s13578-021-00640-2 [PubMed]
- 81. Huang ZH, Qiao J, Feng YY, Qiu MT, Cheng T, Wang J, Zheng CF, Lv ZQ, Wang CH. Reticulocalbin-1 knockdown increases the sensitivity of cells to Adriamycin in nasopharyngeal carcinoma and promotes endoplasmic reticulum stress-induced cell apoptosis. Cell Cycle. 2020; 19:1576–89. https://doi.org/10.1080/15384101.2020.1733750 [PubMed]