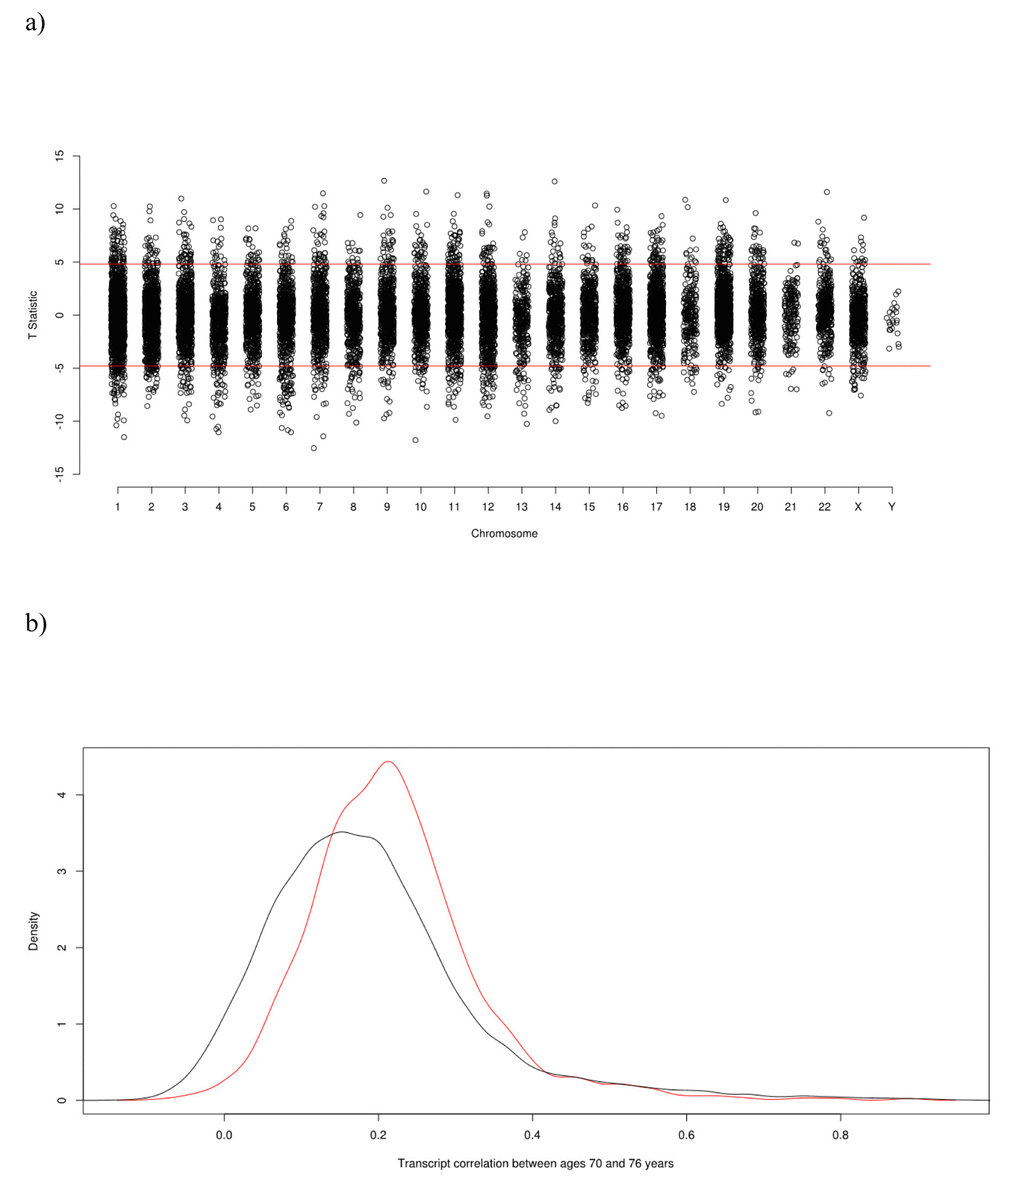
Figure 1.(a) Transcriptome-Wide Association Study Manhattan Plot of the paired t-test T-statistic for difference in expression at age 70 and age 76. (b) Density Plot of transcript (Pearson) correlations between ages 70 and 76. The red curve is the correlation distribution for the Bonferroni corrected significant transcripts that either increase or decrease in expression levels with age; the black curve is for all transcripts.