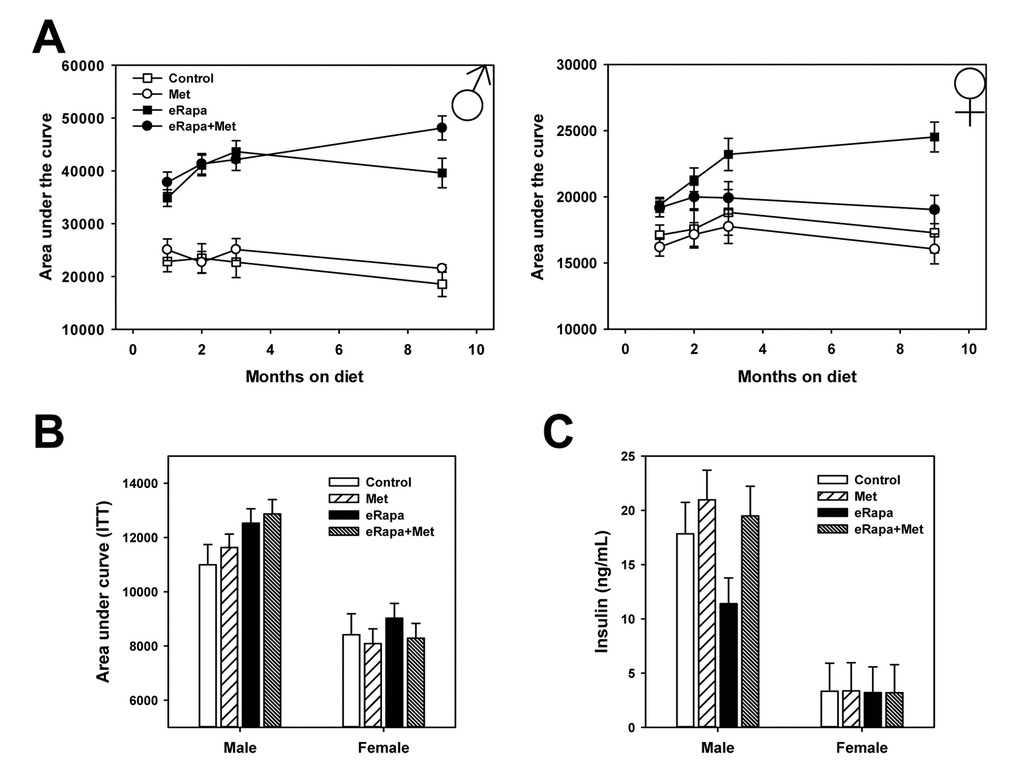
Figure 3.Combined effects of rapamycin and metformin on glucose metabolism. (A) Area under the curve for glucose tolerance tests repeated in the same cohort of animals following indicated months of treatment. Symbols represent mean values for indicated group at each time point ± SEM. (B) Area under the curve calculated for insulin tolerance tests performed following 3 months of treatment. Bars represent mean values for indicated group at each time point ± SEM. (C) Insulin concentration in plasma collected from fed mice following 9 months of treatment on the indicated diets. Bars represent mean values for indicated group at each time point ± SEM. For glucose and insulin tolerance test, n=8-10 for all groups. For insulin measurements, n=8-10 for all groups.