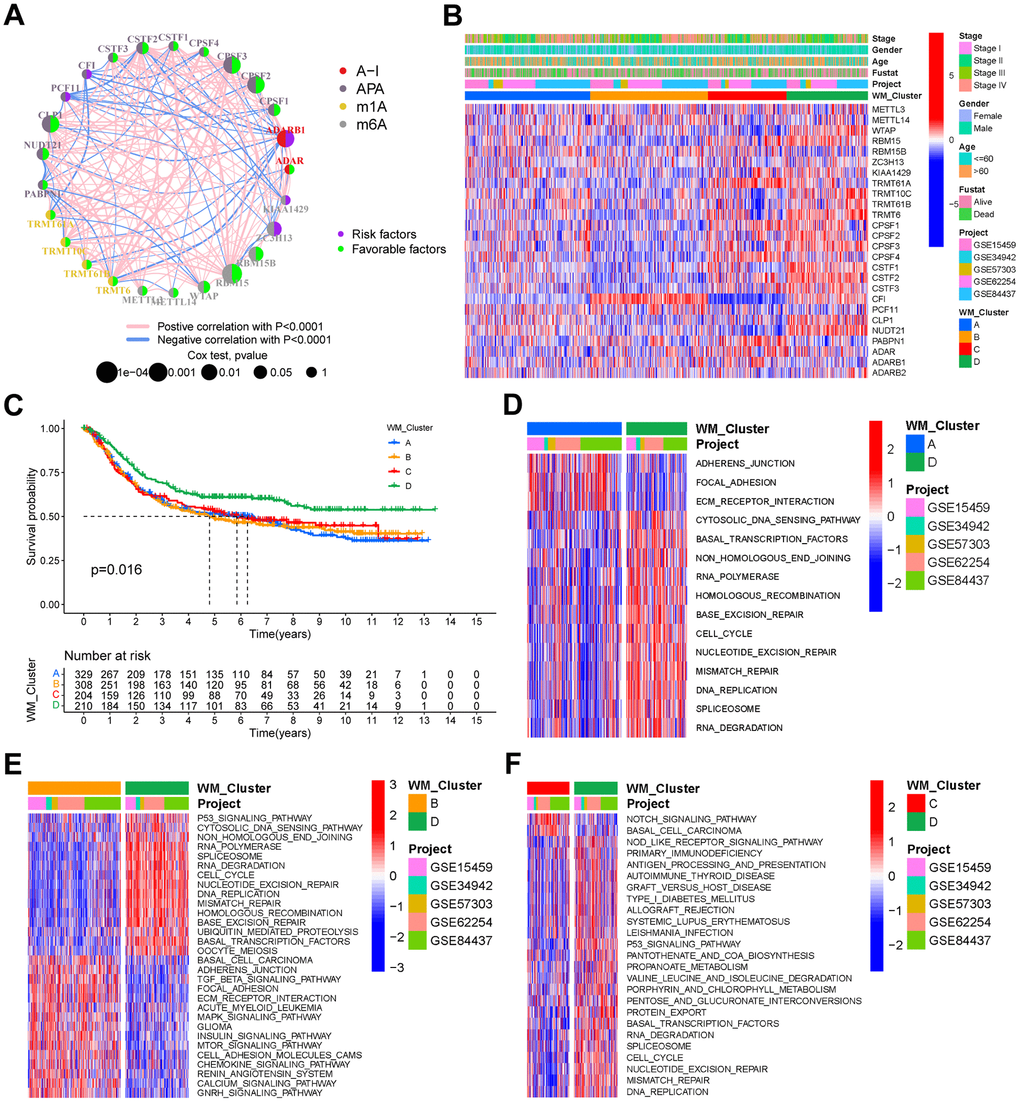
Figure 2.RNA modification patterns and different biological characteristics between these patterns. (A) Interactions between RNA modification writers in gastric cancer. Circle size represents the effect of each regulator on prognosis, and the range of values calculated by the Log-rank test was p <1e-04, p < 0.001, p < 0.01, p < 0.05, and p < 1, respectively. (B) Unsupervised clustering of the 26 writers in the meta-GEO cohort. WM_Cluster, GC cohort names, tumor stage, survival status, age, and gender were used as patient annotations. Red represents a high expression of the writers, and blue represents a low expression. (C) Kaplan–Meier curve showing the overall survival status of four types of RNA modification patterns based on 1051 patients of the meta-GEO cohort. WM_Cluster A, blue; WM_Cluster B, orange; WM_Cluster C, red; WM_Cluster D, green. The grouping status of the patients is indicated at the bottom of the chart. P < 0.05 in the Log-rank test was considered statistically significant. (D–F) GSVA enrichment analysis shows differentially activated biological pathways between the RNA modification patterns. Heatmaps were used to visualize these biological processes. Red represents activated pathways, whilst blue represents inhibited pathways. GC cohort names and WM_Cluster were used as patient annotations. (D) WM_Cluster A vs WM_Cluster D; (E) WM_Cluster B vs WM_Cluster D; (F) WM_Cluster C vs WM_Cluster D.