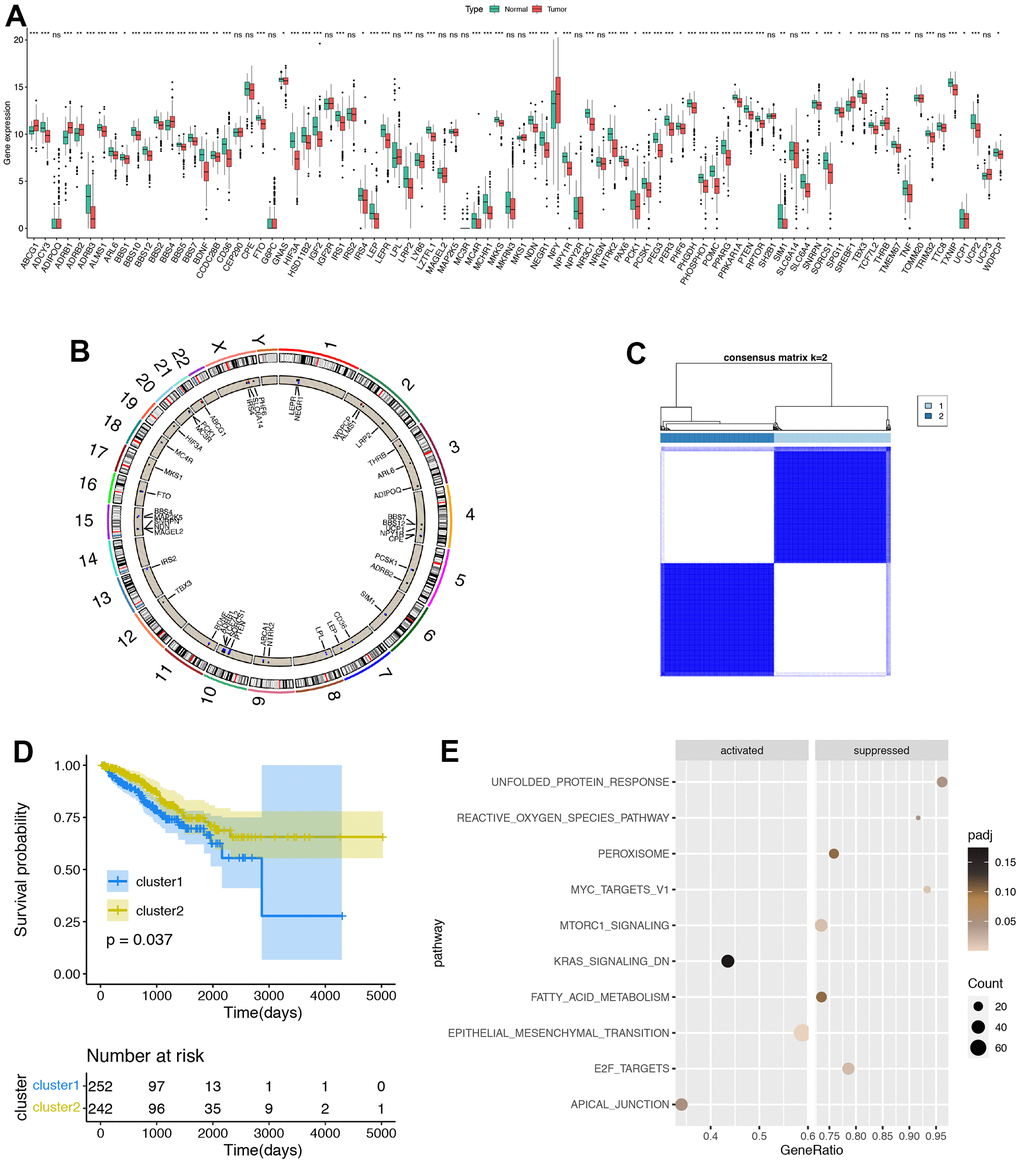
Figure 1.Development of obesity related genes (ORGs) regulated patterns in prostate adenocarcinoma (PRAD). (A) The expression of ORGs in PRAD and normal prostate tissues, Normal, blue; Tumor, red. (B) The comprehensive interactions between ORGs. The size of circles represented the different effects of genes on the prognosis. Blue dots in the circles showed favorable factors for progression free survival (PFS), while red dots showed risk factors. (C) Two clusters were generated by unsupervised clustering based on those ORGs. (D) Kaplan-Meier plots between two ORGs regulated patterns. Blue line showed ORGs cluster 1, while red line showed ORGs cluster 2. (E) Gene set enrichment analysis (GSEA) of hallmark pathways between ORGs cluster1 and cluster2. *p < 0.05; **p < 0.01; ***p < 0.001; ****p < 0.0001. ns, not significant.