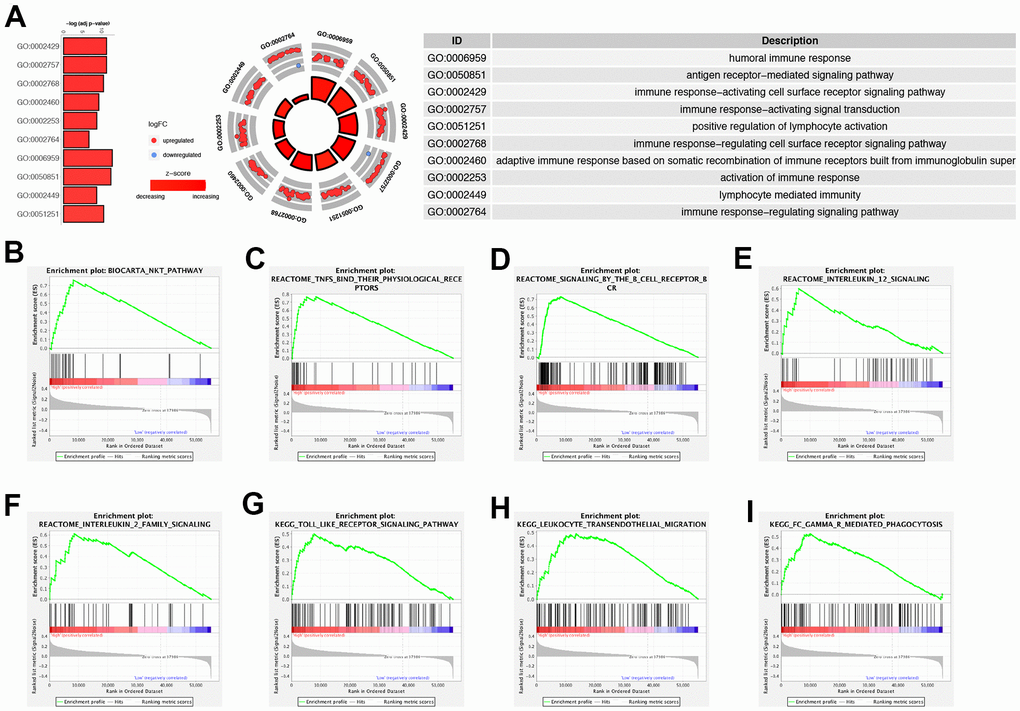
Figure 6.Functional enrichment analysis and GSEA analysis. (A) GO circle plots displayed scatter plots of log fold change (logFC) for the most statistically significant GO terms. Red dots represented up-regulated genes and blue dots represented down-regulated genes. The inner circles displayed z-scores calculated as the number of up-regulated genes minus the number of down-regulated genes divided by the square root of the count. (B–I) GSEA analysis exhibited that Biocarta NAK pathway (B), Reactome TNFs their physiological receptors (C), Reactome signaling by the B Cell receptor bcr (D), Reactome interleukin 12 signaling (E), Reactome interleukin 2 family signaling (F), KEGG toll like receptor signaling pathway (G), KEGG leukocyte trans-endothelial migration (H) and KEGG fc gamma r mediated phagocytosis (I) were enriched in the high-risk group compared with low-risk group.