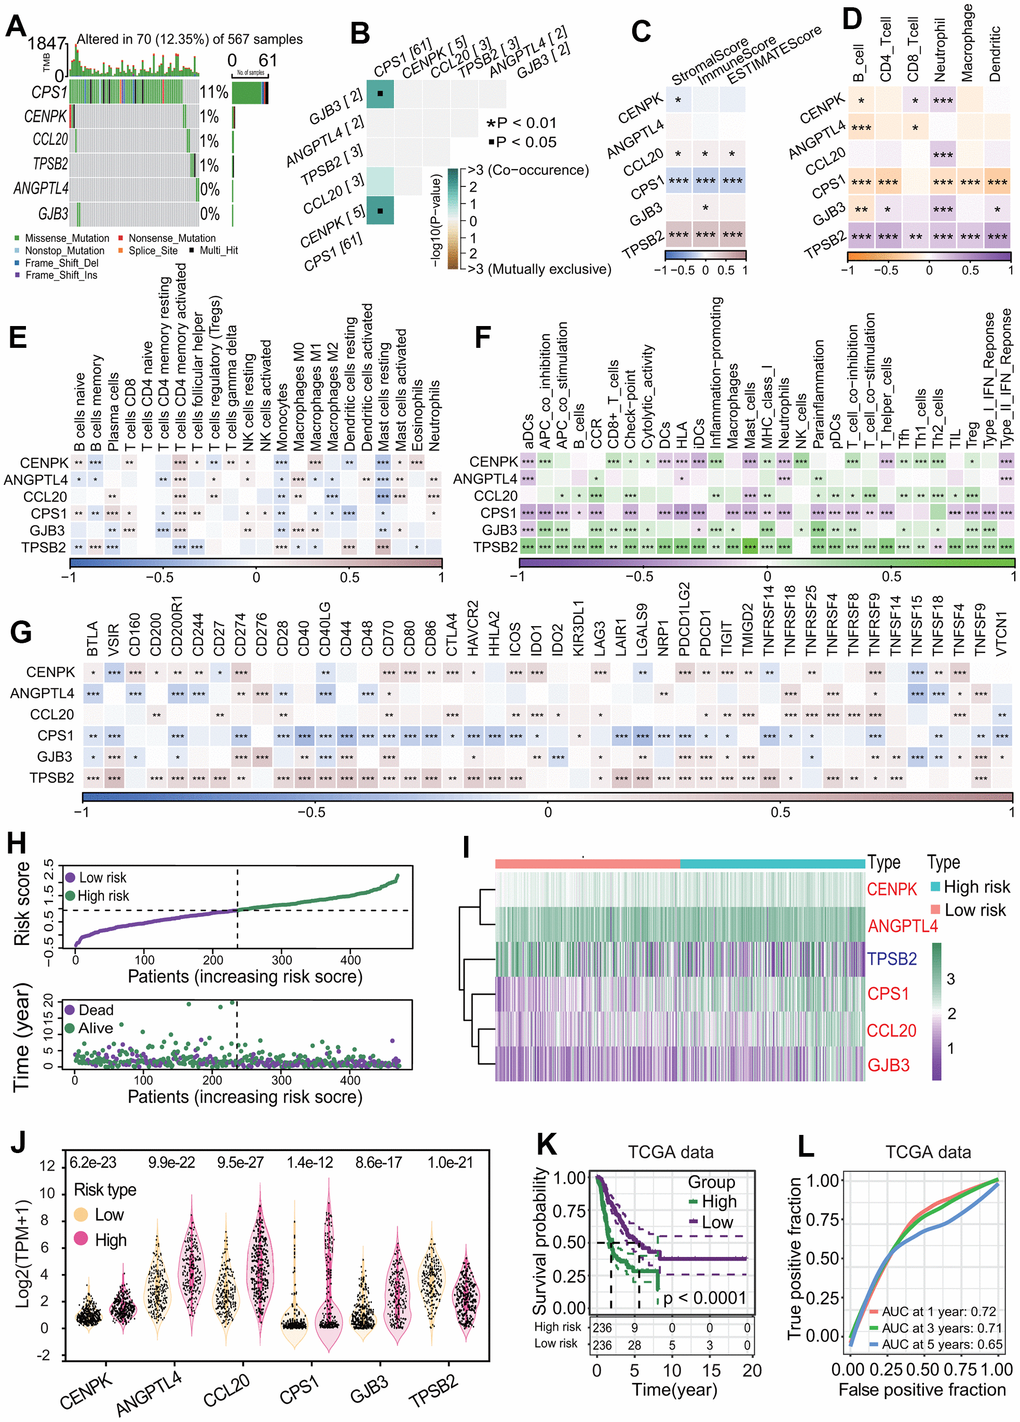
Figure 9.Correlation of six differentially expressed genes (DEGs) with immunity and establishment of six-gene prognostic signature. (A) Gene mutation profiles of six DEGs. Only 12.35% of LUAD samples had one or more mutations in six DEGs (CPS1, ANGPTL4, CCL20, CENPK, GJB3, TPSB2). (B) Co-occurrence and mutually exclusive of gene mutation. Six DEGs had lower co-occurrence and are mutually exclusive. (C) Correlation of six DEGs with stromal and immune cell infiltration. Two genes including CPS1 and TPSB2 were strongly negatively and positively correlated with three infiltration scores of two cells including stromal and immune cells, respectively. *p < 0.05, **p < 0.01 and ***p < 0.001. (D) Correlations of six DEGs with infiltrations of six immune cells. The expressions of six DEGs had significant correlations with one or more types of immune cells. In particular, CPS1 and TPSB2 were strongly negatively and positively correlated with immune infiltrations of six types of immune cells, respectively. *p < 0.05, **p < 0.01 and ***p < 0.001. (E) Correlations of six DEGs with 22 immune cell types. In general, the expressions of 6 DEGs (CPS1, ANGPTL4, CCL20, CENPK, GJB3, TPSB2) were strongly correlated with 22 immune cell types. *p < 0.05, **p < 0.01 and ***p < 0.001. (F) Correlations of six DEGs with 29 immune cell types. The expressions of six genes had very strong correlations with multiple immune cell types. In particular, CPS1 and TPSB2 were strongly negatively and positively correlated with immune infiltrations of 29 types of immune cells, respectively. *p < 0.05, **p < 0.01 and ***p < 0.001. (G) Correlations of six DEGs with 44 immune checkpoint genes. The expressions of six DEGs had very strong correlations with the expressions of multiple checkpoint genes. Especially, CPS1 and TPSB2 were strongly negatively and positively correlated with most checkpoint genes, respectively. *p < 0.05, **p < 0.01 and ***p < 0.001. (H) Risk score distribution and survival overview of LUAD patients. According to the median risk score, LUAD patients were divided into high- and low-risk subgroups. (I, J) Expression levels of six prognostic genes between two risk subgroups. Five genes including CENPK, ANGPTL4, CPS1, CCL20 and GJB3 were highly expressed and TPSB2 gene were lowly expressed in the high-risk subgroup. (K) Survival curve. LUAD patients in the low-risk subgroup had a higher OS rate than that in the high-risk subgroup (p < 0.0001). (L) Receiver operating characteristic (ROC) curve. The areas under the curve (AUCs) associated with 1-year, 3-year and 5-year survival were 0.72, 0.71 and 0.65, respectively.