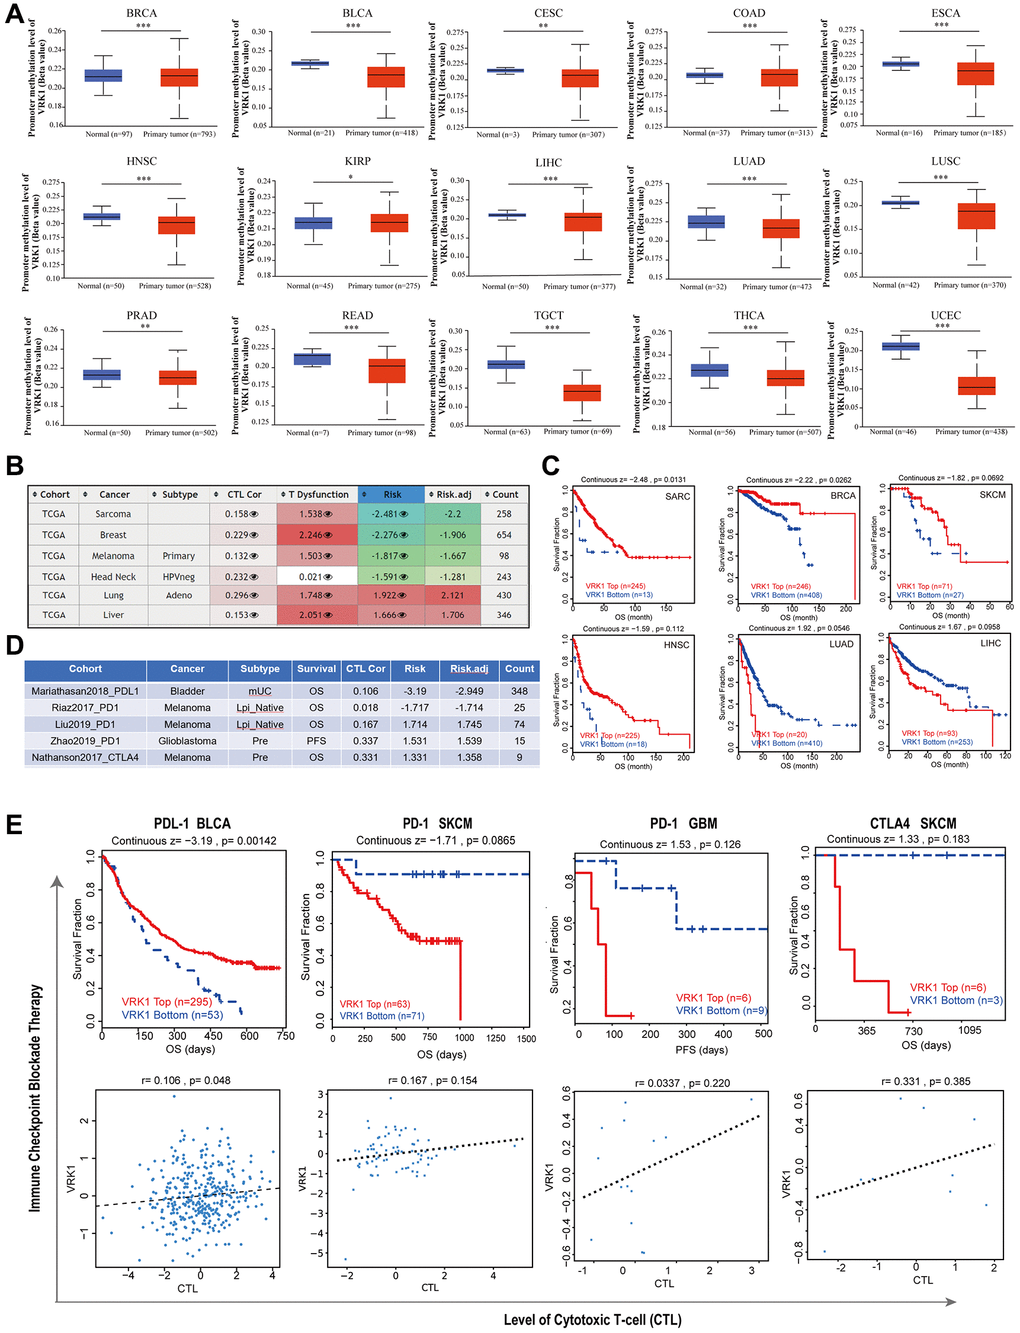
Figure 7.Correlation analysis with methylation profile. (A) Boxplots showing differential VRK1 methylation levels (beta values) between tumors and adjacent tissues across the TCGA dataset. (B) Heatmap showing the roles of VRK1 methylation in cytotoxic T-cell levels (CTLs), dysfunctional T-cell phenotypes, and risk factors of TCGA cancer cohorts. (C) Kaplan-Meier curves of OS differences between TCGA cancer cohorts with high methylation levels and those with low methylation levels of VRK1. (D, E) The upper panel displays Kaplan-Meier curves illustrating the survival ratios of cancer cohorts with high and low expression levels of VRK1 as a measure of the immunotherapeutic response (immune checkpoint blockade). The lower panel presents the correlation between VRK1 expression levels and cytotoxic T-cell levels (CTL) in these cohorts. Only statistically significant differences between the cohorts in TCGA cancers are included in the analysis.