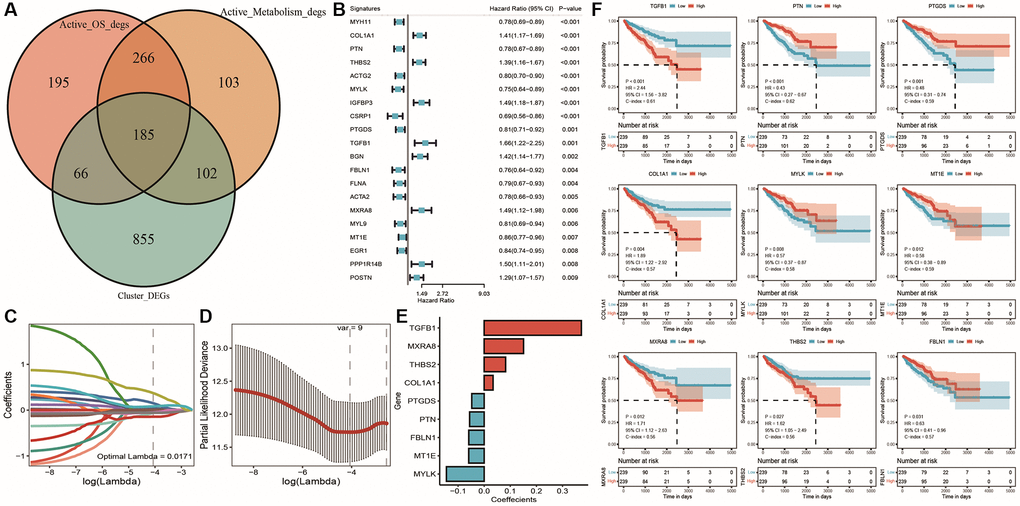
Figure 8.Lasso regression analysis results for TCGA dataset. (A) Venn diagram of differentially expressed genes between subtypes and active cell populations; (B) Forest plot of single-factor Cox analysis results for common differentially expressed genes; (C) Trajectory of changes in Lasso regression independent variables, with the x-axis representing the logarithm of the independent variable Lambda and the y-axis representing the coefficient of the independent variable; (D) Confidence intervals for each Lambda in Lasso regression; (E) Lasso regression coefficients for nine key prognostic factors; (F) KM curves for model genes, with red indicating high expression group, blue indicating low expression group, and p-value indicating the significance of survival curve differences.