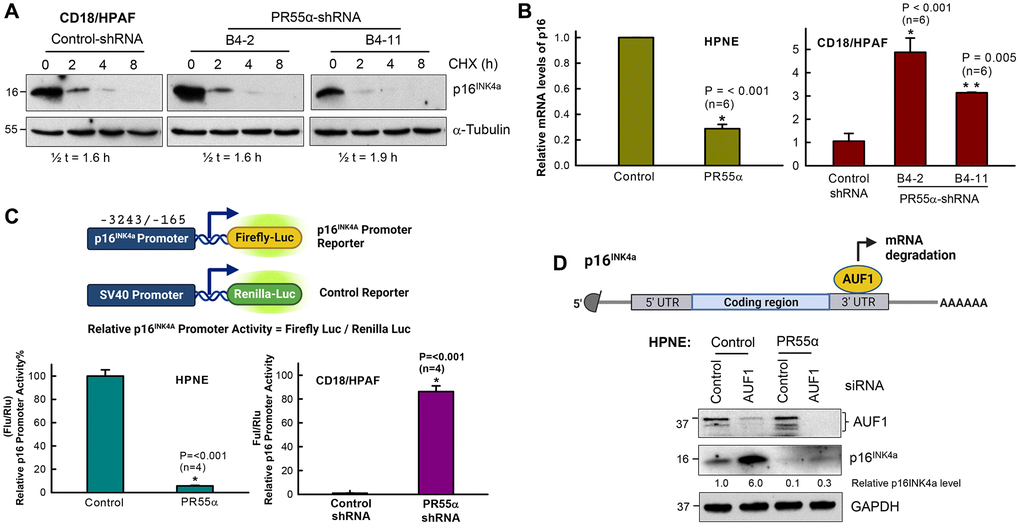
Figure 3.PR55α inhibits p16 expression by suppressing its mRNA transcription. (A) PR55α does not affect p16 protein stability. CD18/HPAF cells stably transduced with Dox-inducible PR55α-shRNA or Control-shRNA were cultivated in media containing 2 μg/ml Dox for 5 days to induce the shRNA, after which cells were exposed to cycloheximide (CHX, 15 μg/ml) to halt protein synthesis. Cell lysates collected at the indicated time points after CHX addition were analyzed for changes in p16 protein levels. The α-tubulin protein has a long half-life and was used as an internal control. Relative p16 protein levels were determined after normalization with the α-tubulin levels and these normalized values were used to calculate the protein half-life of p16. Half-lives were estimated by linear regression analysis of p16 normalized levels against time using SigmaPlot. (B) PR55α inhibits p16 mRNA expression. Left panel: HPNE expressing the Dox-inducible PR55α (HPNE/PR55α), or empty vector (HPNE/Control) was treated with Dox (1 μg/ml) for 3 days. Right panel: CD18/HPAF cells expressing the Dox-inducible PR55α shRNA (B4-2, B4-11) or Control shRNA (Control) were treated with Dox (2 μg/ml) for 5 days. At the end of each treatment, RNA was isolated and analyzed by quantitative RT-PCR for differences in p16 mRNA. The relative abundance of the p16 mRNA was calculated by normalizing the p16 mRNA levels with those of the GAPDH mRNA, with the data represented as mean ± S.D. (bar graphs). Statistical significance was calculated by a Student’s t-test (HPNE cells) or one-way ANOVA (CD18/HPAF). The difference with the Control group (n = 6/group) was determined to be statistically significant at *p < 0.001 or **p < 0.005. (C) PR55α suppresses p16 promoter activity. HPNE and CD18/HPAF cells in the presence/absence of ectopic PR55α and PR55α-shRNA expression, respectively, were co-transfected with a Firefly luciferase reporter under the control of the p16 promoter and a control Renilla luciferase reporter driven by the SV40 promoter. Two days after transfection, Firefly, and Renilla luciferase activities were measured separately in each lysate, as described in the Materials and Methods. p16 promoter activity was calculated by normalizing the activity of Firefly luciferase over that of Renilla luciferase. The graphs show relative p16 promoter activities in the indicated cell samples and are expressed as the mean ± S.D. of two independent experiments done in duplicates. *Statistically significant in a Student’s t-test with p < 0.001. (D) HPNE/Control and HPNE/PR55α cells were incubated in the presence of 1 μg/ml Dox for 48 h to induce PR55α expression, after which cells were transfected with either a non-targeting siRNA (Control) or AUF1 siRNA. Two days later, cells were analyzed by immunoblotting for differences in levels of AUF1 and p16. GAPDH was used as an internal standard. The levels of p16 and GAPDH were quantified using Fiji-ImageJ software and relative p16 levels in the samples were determined after normalizing it with GAPDH levels.