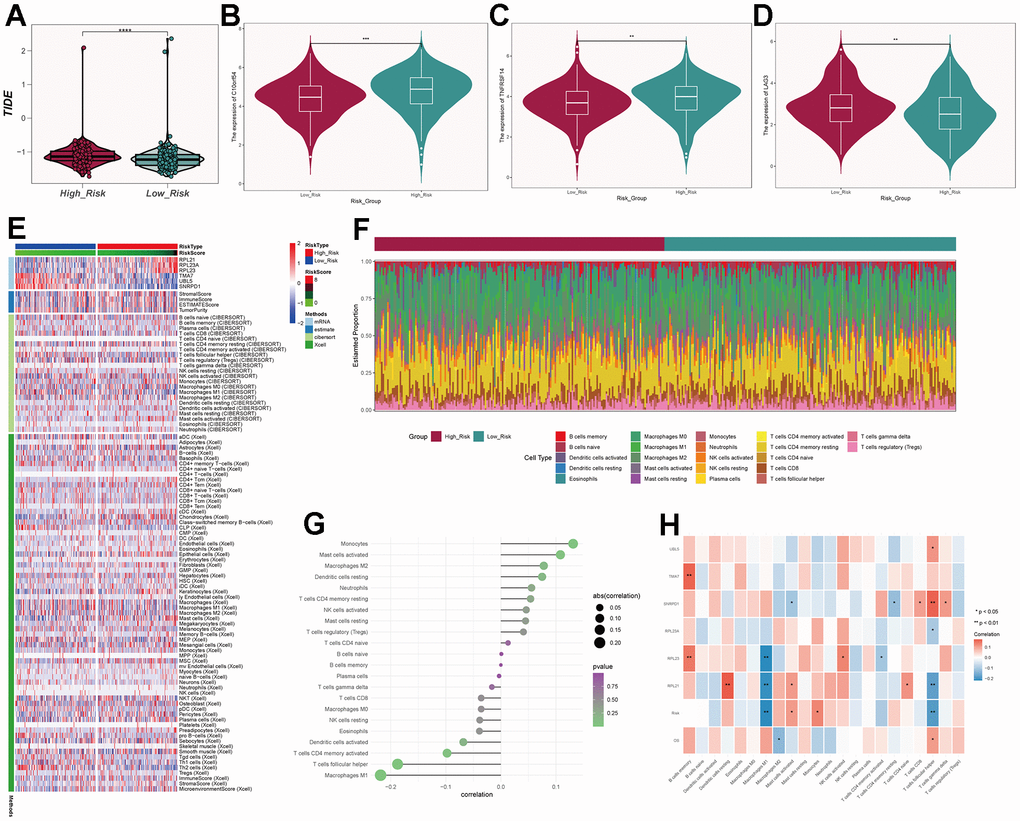
Figure 11.Immune-related analysis of C0 subgroup. (A) Violin plot of TIDE scores for high- and low-risk groups. (B–D) Immune checkpoint scores for high- and low-risk groups. (E) Heatmap showing differences in predictive genes, tumor microenvironment, and immune cells between high- and low-risk groups. (F) Proportion of immune cells in high- and low-risk groups. (G) Correlation between immune cells and risk scores. (H) Correlation between immune cells, prognosis-related genes, risk scores, and overall survival (OS).