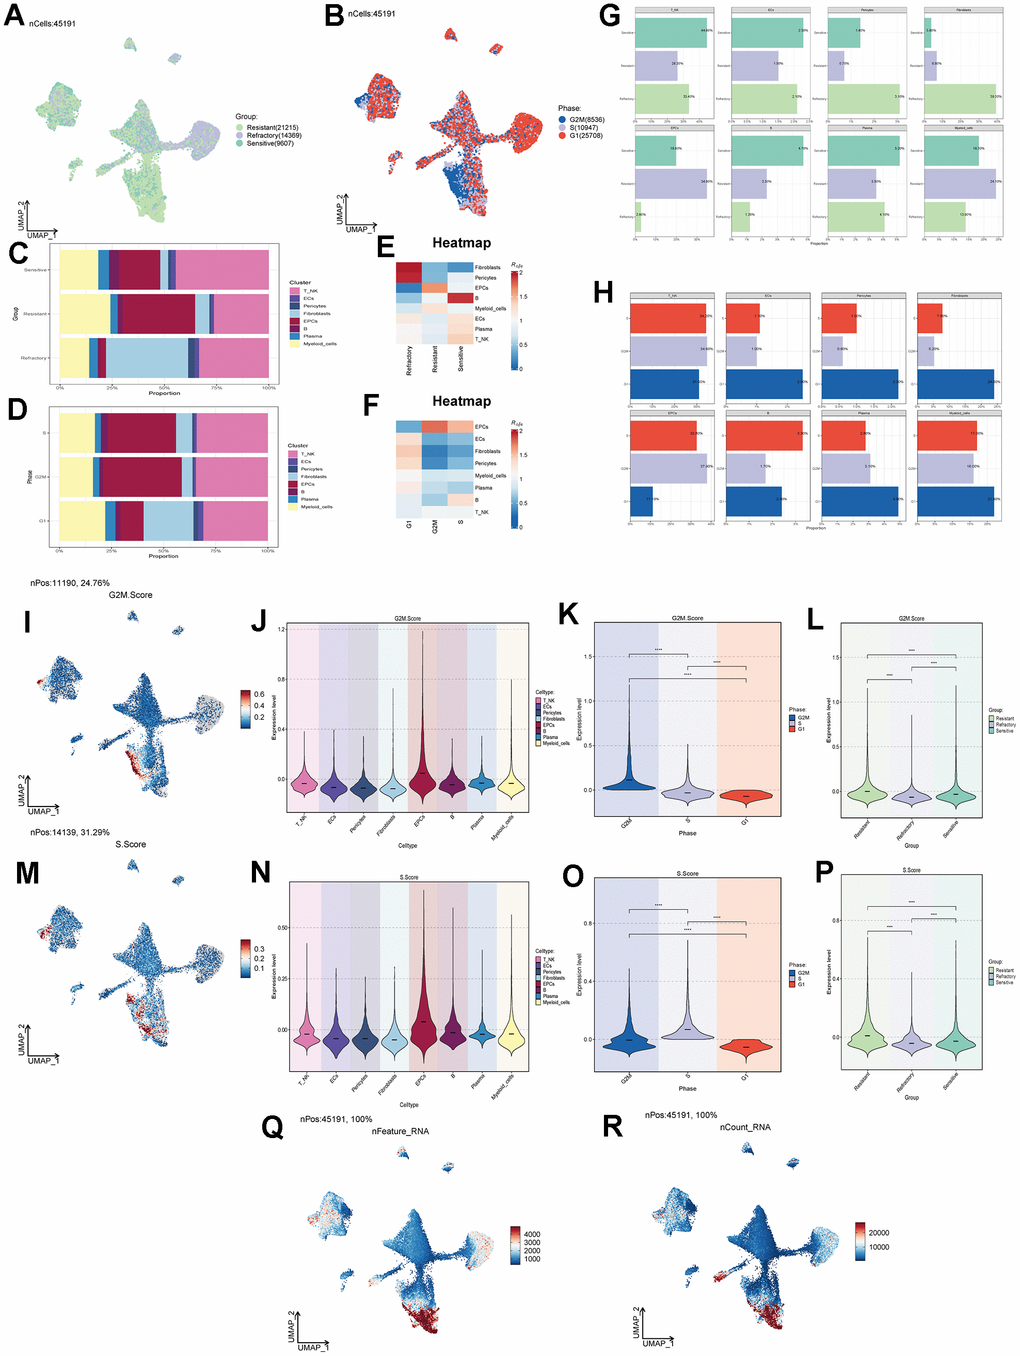
Figure 2.Cell clustering by staging and drug treatment response level. (A) Distribution of UNMP drug treatment response levels. (B) Distribution of UNMP cell staging within major cell clusters. (C) Proportion of major cell clusters within the Resistant, Refractory, and Sensitive response groups. (D) Proportion of major cell clusters within the G2M, S, and G1 cell staging phases. (E, F) Abundance of major cell clusters concerning drug response groups and cell staging. (G) Proportion of major cell clusters within the Resistant, Refractory, and Sensitive response groups and their facets were shown. (H) Proportion of major cell clusters within the G2M, S, and G1 cell staging phases and their facets were shown. (I) Distribution of UNMP G2M.Score. (J–L) Violin plots for G2M.Score in major ovarian cancer cell clusters, cell staging, and drug response. (M) Distribution of UNMP S.Score. (N–P) Violin plots for S.Score in major ovarian cancer cell clusters, cell staging, and drug response. (Q, R) Distribution of UNMP nFeature and nCount.