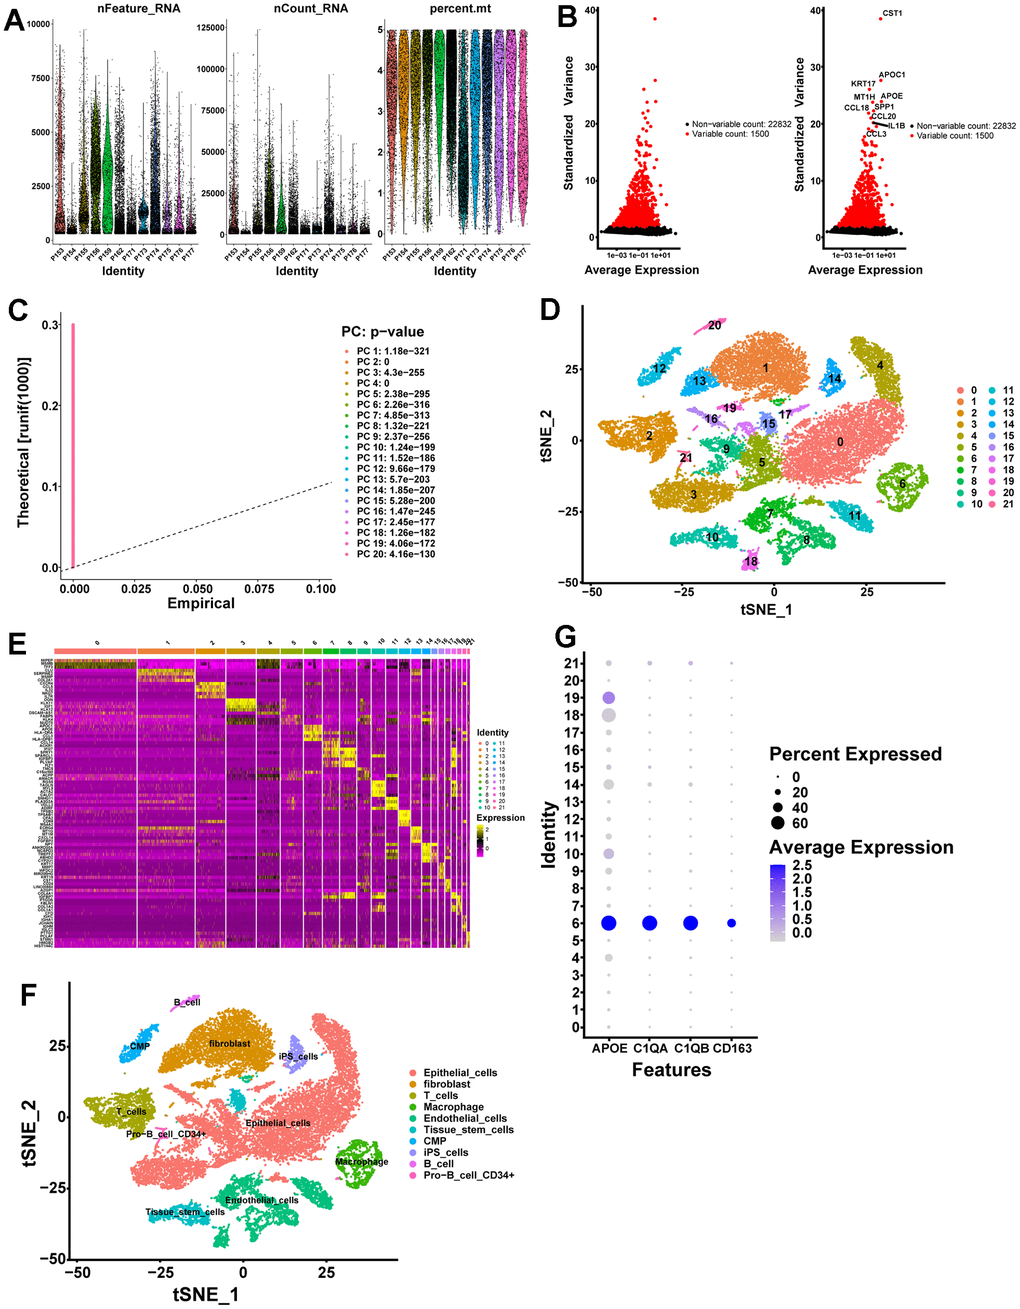
Figure 1.scRNA-seq analysis identifies marker genes for macrophages. (A) A total of 25999 eligible cells were identified after quality control of scRNA-seq data with twelve PCa samples. (B) Variation in gene expression across all PCa cells is shown in the variance plot. The black dots represent non-variable genes, while the red dots represent highly variable genes. (C) A P-value of 0.05 identified 20 PCs. (D) A t-SNE algorithm was applied to visualize 22 clusters. (E) The top 5 marker genes in each cell cluster are displayed in a heatmap. Genes with high expression are yellow, and genes with low expression are purple. (F) Cell types identified by marker genes. (G) Macrophage marker gene expression levels in each cell cluster are represented by bubble plots.