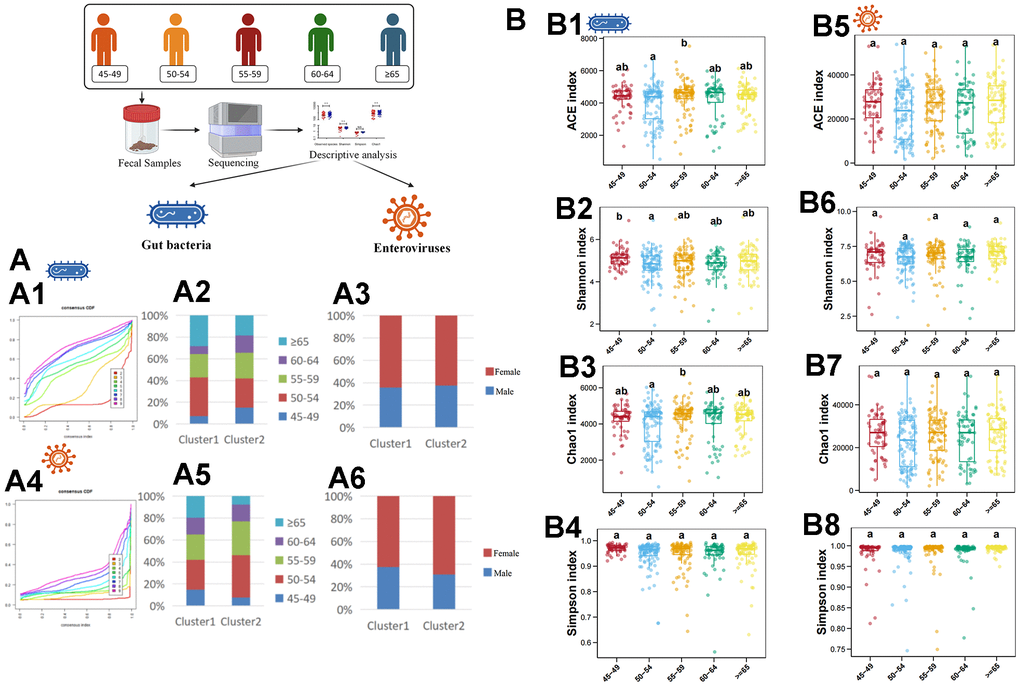
Figure 1.Descriptive analysis of gut bacteria and enteroviruses. (A1) shows the unsupervised clustering of samples based on gut bacteria in species level. (A2) shows the age-related composition ratio of each cluster based on gut bacteria in species level. (A3) shows the sex-related composition ratio of each cluster based on gut bacteria in species level. (A4) shows the unsupervised clustering of samples based on enterovirus in genus level. (A5) shows the age-related composition ratio of each cluster based on enterovirus in genus level. (A6) shows the sex-related composition ratio of each cluster based on enterovirus in genus level. (B1–B4) plots the ACE, Shannon, Chao1, and Simpson index of gut bacteria in species levels, respectively. (B5–B8) plots the ACE, Shannon, Chao1, and Simpson index of enterovirus in genus level, respectively. The a, b, and ab in (B) indicate that there are statistical differences between different labels in different groups.