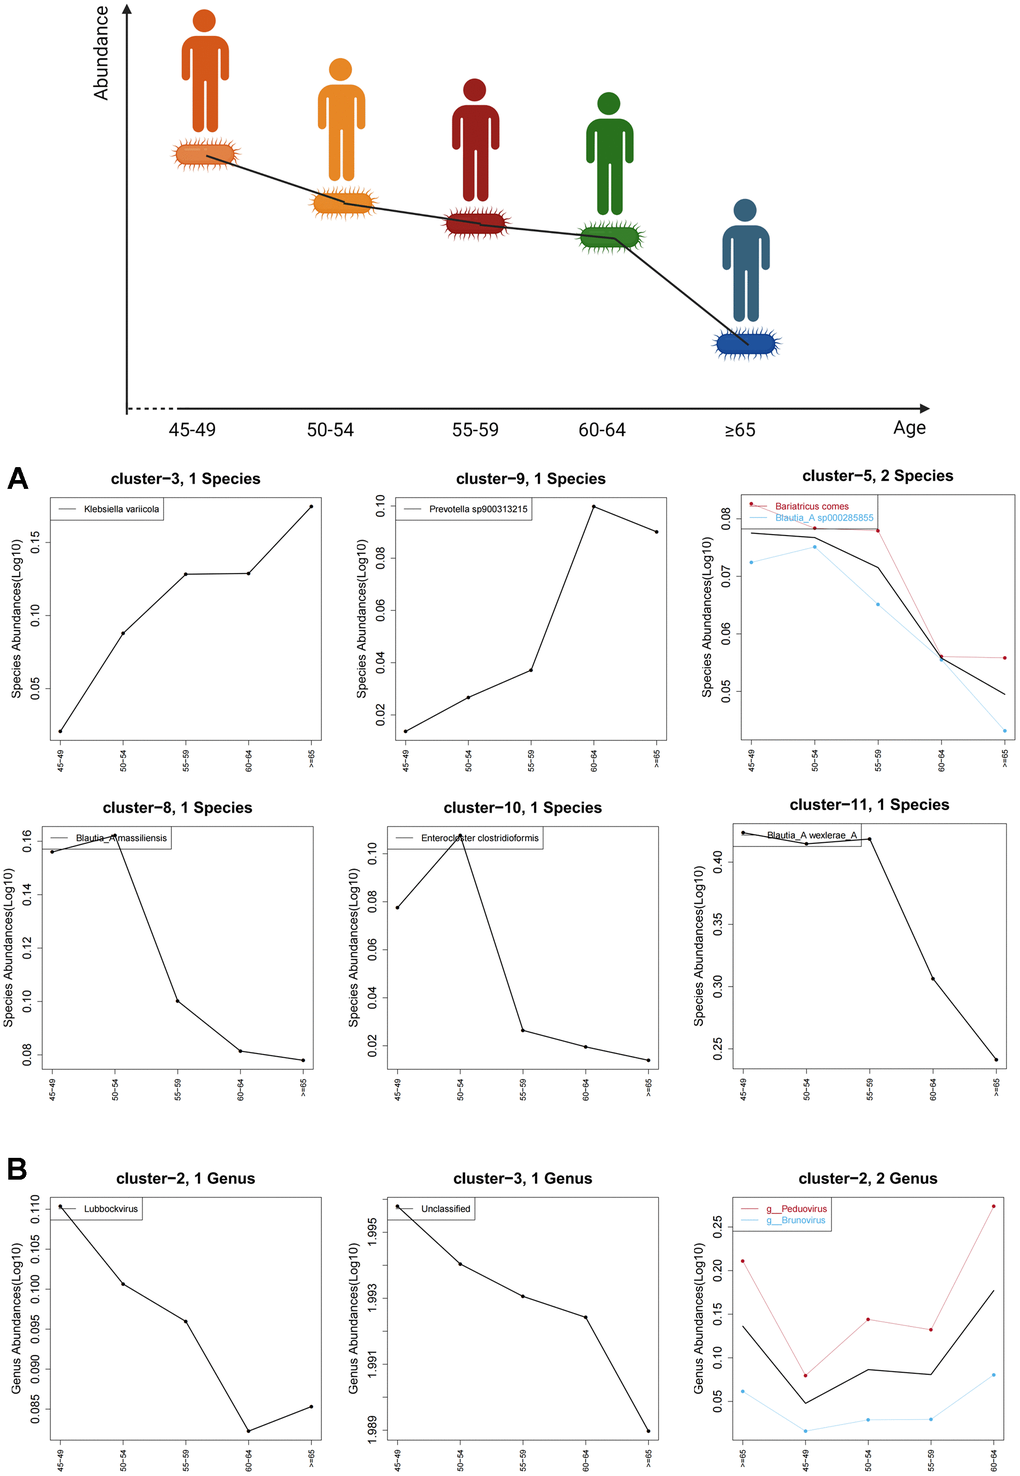
Figure 4.Age-related trends in characteristic gut bacteria and enterovirus. (A) shows the trend of characteristic gut bacteria with age in species level and (B) shows the trend of characteristic enteroviruses with age in genus level. The black curve shows the overall age-related trend of all species in the cluster, while the other colored curves represent age trends for microbes with associated labels.