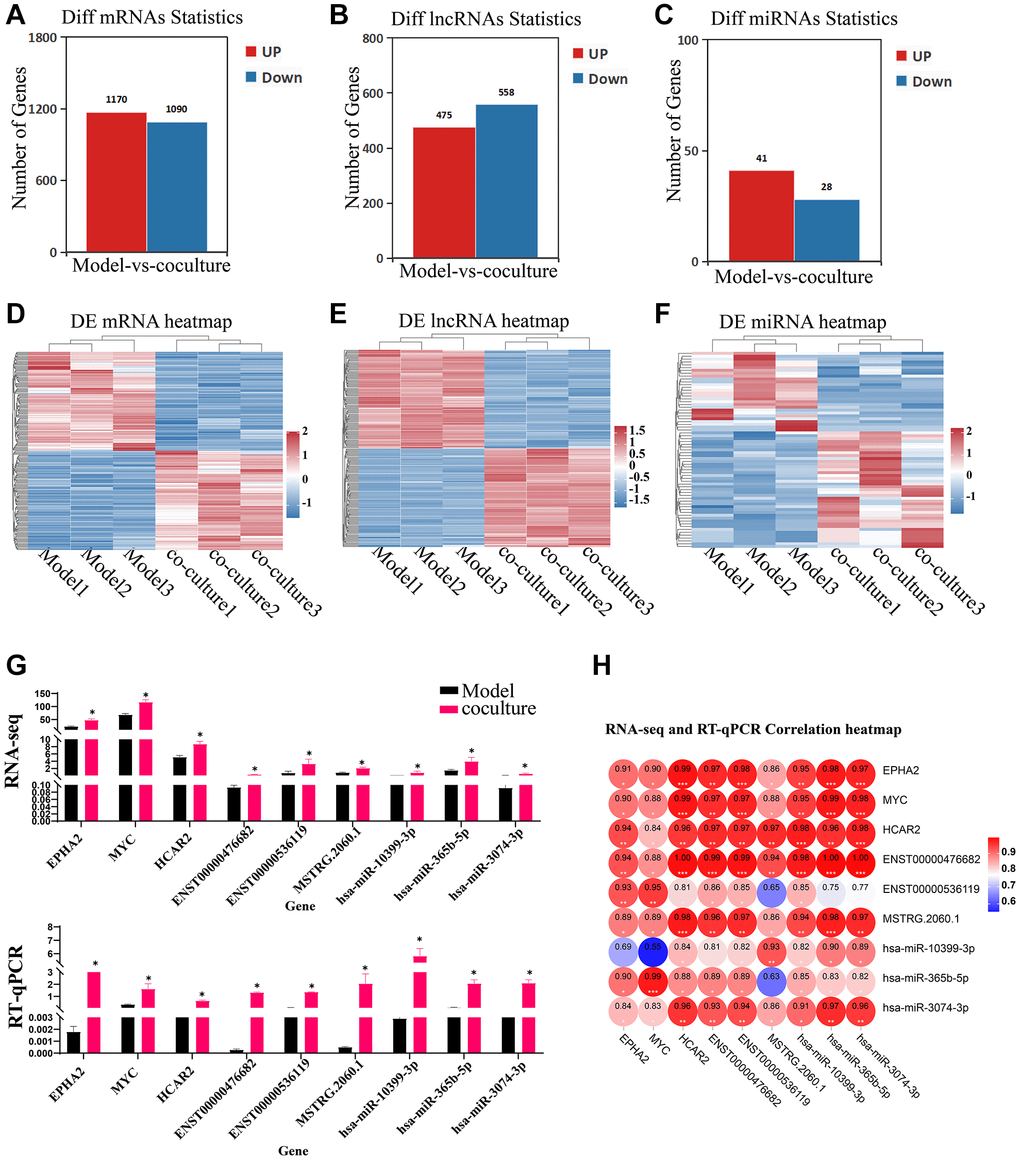
Figure 3.Identification of DEGs, DELs and DEMs. (A–C) Bar chart of DE mRNAs, lncRNAs and miRNAs. (D–F) Heatmap of DE mRNAs, lncRNAs and miRNAs. (G) RT-qPCR validating of the RNA sequencing data using 3 DE mRNAs, lncRNAs and DE miRNAs chosen at random (the upper panel represents the fpkm of RNA-seq, and the following graph represents the expression of RT-qPCR). (H) RNA-seq and RT-qPCR correlation heatmap. The measured values represent the mean ± standard deviation (X ± s) of three replicate experiments. *P < 0.05.