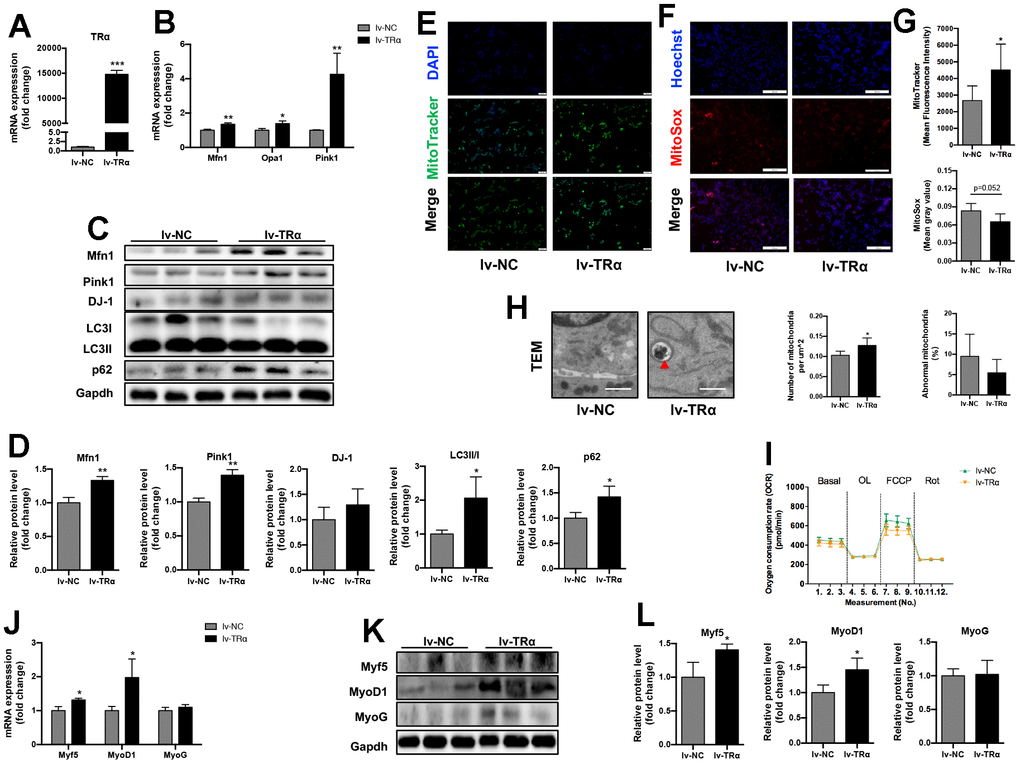
Figure 5.Overexpression of TRα in C2C12. Cells were transfected with TRα-targeted overexpression plasmid or non-targeted plasmid for 24h, 48h or 72h. lv-NC negative control, lv-TRα overexpressing plasmid-vector TRα. (A) mRNA level of TRα, n=3; (B) mRNA levels of Mfn1, Opa1 and Pink1, n=3; (C) Representative Western blots and (D) quantification of Mfn1, Pink1, DJ-1, LC3II/I, p62 and Gapdh (loading control), n=3; (E) Representative MitoTracker immunofluorescence staining of cells, nuclei were counterstained with DAPI, scale bar: 100 μm; (F) Representative MitoSox immunofluorescence staining of cells, nuclei were counterstained with Hoechst, scale bar: 200 μm; (G) Quantification of MitoTracker Green fluorescence intensity (n=8) and MitoSox Red fluorescence intensity (n=5), respectively, fluorescence intensity was quantified using densitometric image analysis software with cell quantity adjustment; (H) Representative transmission electron microscopy images of mitochondria and quantification of mitochondrial number and percentage of abnormal mitochondria, the red ‘▲’ is labeling mitochondria inside autophagic vesicles, Scale bar: 1 μm, n=5; (I) Seahorse analysis of oxygen consumption rate (OCR), OCR was measured continuously throughout the experimental period at baseline and in the presence of the indicated drugs: 1.5 μM oligomycin, 0.5 μM FCCP and 0.5 μM rotenone, n=4; (J) mRNA levels of Myf5, MyoD1 and MyoG, n=3; (K) Representative Western blots and (L) quantification of Myf5, MyoD1, MyoG and Gapdh (loading control), n=3. *p<0.05, **p<0.01 vs. control group (lv-NC). All experiments were repeated three independent times.