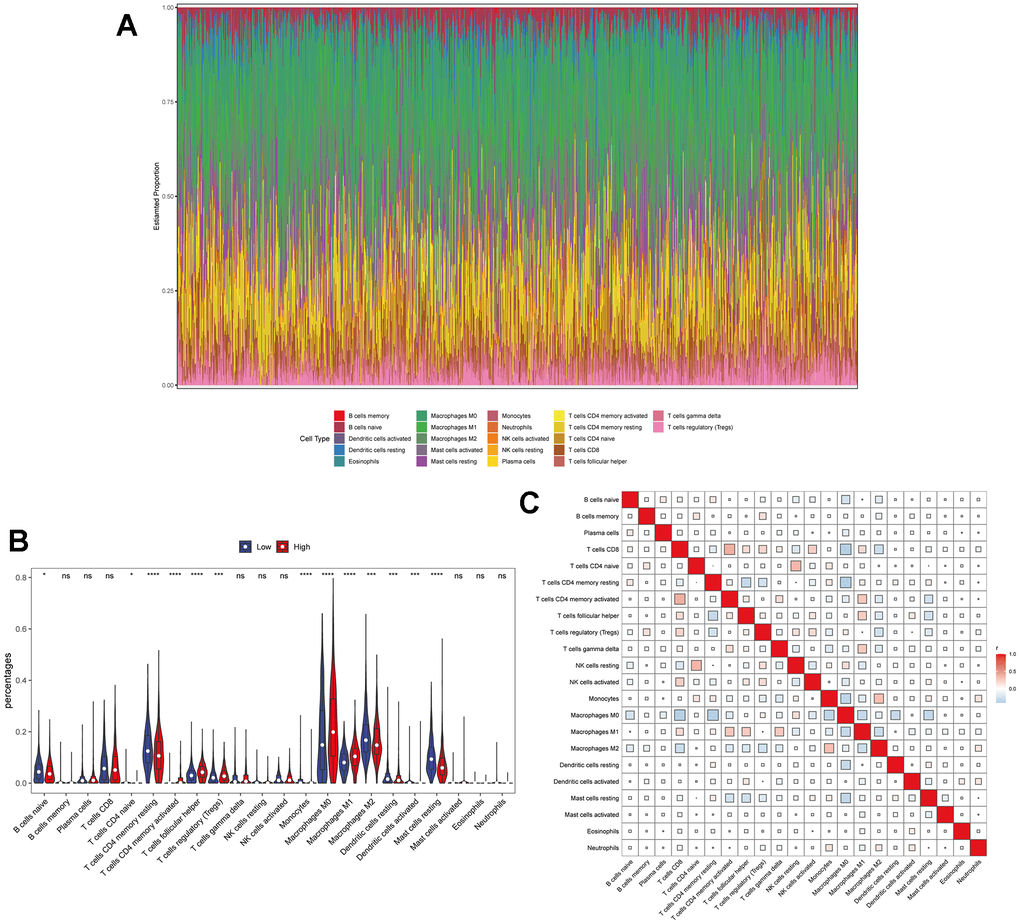
Figure 7.The relationship between TPX2 expression and tumor-infiltrating immune cells. (A) Stacked bar chart shows distribution of 22 immune cells in each sample. (B) Violin plot displays the differentially infiltrated immune cells between TPX2-High group and TPX2-Low group. Red color represents TPX2-High group, and blue color represents TPX2-Low group. (C) Correlation matrix of immune cell proportions. The red color represents positive correlation and the blue color represents negative correlation.