Abstract
The physical manifestations of aging reflect a loss of homeostasis that effects molecular, cellular and organ system functional capacity. As a sentinel homeostatic pathway, changes in apoptosis can have pathophysiological consequences in both aging and disease. To assess baseline global apoptosis balance, sera from 204 clinically normal subjects had levels of sFas (inhibitor of apoptosis), sFasL (stimulator of apoptosis), and total cytochrome c (released from cells during apoptosis) measured. Serum levels of sFas were significantly higher while sFasL and cytochrome c levels were lower in men compared to women. With increasing age there was a decrease in apoptotic markers (cytochrome c) and pro-apoptotic factors (sFasL) and an increase in anti-apoptotic factors (sFas) in circulation. The observed gender differences are consistent with the known differences between genders in mortality and morbidity. In a separate cohort, subjects with either breast (n = 66) or prostate cancer (n = 38) exhibited significantly elevated sFas with reduced sFasL and total cytochrome c regardless of age. These markers correlated with disease severity consistent with tumor subversion of apoptosis. The shift toward less global apoptosis with increasing age in normal subjects is consistent with increased incidence of diseases whose pathophysiology involves apoptosis dysregulation.
Introduction
Apoptosis is an evolutionary conserved
program that leads to cell death. Apoptotic cell death plays a role in normal
development (e.g. - embryogenesis, morphogenesis) and in maintaining adult
homeostasis (e.g. - immune response resolution, tissue remodeling, elimination
of damaged/dysfunctional cells) [1,2]. The
physical manifestations of aging reflect a loss of homeostasis that effects
molecular, cellular and organ system functional capacity. As a sentinel
homeostatic pathway, changes in apoptosis can have patho-physiological
consequences in aging. For example, too much apoptosis can yield tissue
degeneration [3-6], while too little apoptosis allows either
dysfunctional cells to accumulate or differentiated immune cells to persist [7-9]. Thus,
cellular maintenance protocols involve a delicate balance in pro- and
anti-apoptotic factors/signals.
Fas is a cell-surface receptor that transduces
apoptotic signals from another cell-surface receptor Fas ligand, FasL [10,11]. Fas and
FasL have also been observed as soluble molecules. Soluble Fas arises from
alternatively spliced mRNA [9,10] and all variants of sFas inhibit apoptosis
induced by FasL [12,13]. FasL can undergo proteolytic cleavage to liberate a 26
kDa soluble form of the molecule [14]. The physiological role of sFasL in the regulation of apoptosis
remains unclear as both stimulatory [15,16] and inhibitory [17,18] activity has been reported. Cytochrome c has a well
defined role in triggering apoptosis and as a marker of apoptosis [19], though it was recently shown that cytochrome c exists in a
complex in serum with leucine-rich alpha-2-glycoprotein-1 which altered
immunoreactivity [20]. In order to assess the global balance of systemic markers of
apoptosis, we developed an immunoassay to measure total serum levels of
cytochrome c and determined the distribution and levels of sFas, sFasL and
total cytochrome c in serum from a large clinically defined normal group. In
addition, we used the same surrogate markers of apoptosis to characterize their
levels in a group well characterized as having altered apoptosis (i.e. - cancer
subjects).
Results
We determined
serum levels of sFas in 204 normal subjects. For all subjects, values for
fasting glucose, thyroid panel, and
calculated BMI were within the normal range.
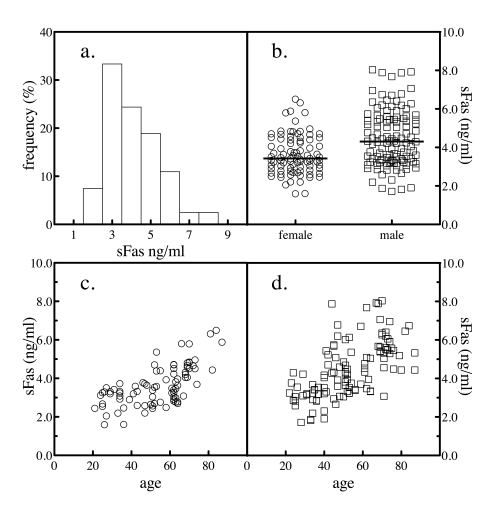
Figure 1. Serum sFas levels. The levels of sFas in 204 normal subjects was
determined by sandwich ELSA. The frequency distribution of the values
across the subjects was analyzed (a). The levels of sFas by gender
were plotted (b). The sample population was segregated by gender and
the levels of serum sFasL as a function of donor age for female (c)
and male (d) subjects were plotted.
Table 1. Serum levels of apoptosis biomarkers.
Biomarker levels were compared by gender. The association of serum levels with donor age was analyzed by Spearman correlation.
a Mann Whitney U-test comparing serum values in females versus males.
b Correlation coefficient (r) for Spearman nonparametric correlation analysis of serum biomarker levels and donor age.
c P value for Spearman nonparametric correlation analysis of serum biomarker levels and donor age.
|
sFas (pg/ml)
|
sFasL (pg/ml)
|
Cytochrome c (μg/ml)
|
|
female
|
male
|
female
|
male
|
female
|
male
|
|
mean±SD
median
(range)
|
3625±1019
3424
(1592-6498)
|
4475±1459
4303
(1710-8026)
|
94.6±22.3
97.9
(45.8-139.4)
|
91.2±20.8
92.4
(40.6-145.6)
|
0.712±0.206
0.663
(0.24-1.33)
|
0.703±0.420
0.566
(0.13-2.22)
|
|
gender a |
p < 0.0001
|
p = 0.13
|
p = 0.053
|
|
age r b |
0.651
|
0.647
|
-0.534
|
-0.337
|
-0.719
|
-0.855
|
|
p value c |
< 0.0001
|
< 0.0001
|
< 0.0001
|
< 0.001
|
< 0.0001
|
< 0.0001
|
The mean value for sFas was 4107 ± 1352 pg/ml. When the frequency
distribution of serum values was analyzed by histogram, a slight hook at the
high end was evident (Figure 1a). The results were stratified by gender to
further study the distribution. For the samples obtained from the 94 female
donors, the mean donor age was 53 and ranged from 21 to 87, while for the 110
male donors, the mean age was 52 and ranged from 22 to 88. Serum levels of sFas
were significantly higher in males than in females, comparing by a Mann Whitney
test (Figure 1b and Table 1). Mean BMI values were 22.6 ± 1.4 and 22.1 ± 1.6
kg/m2 for women and men, respectively. The difference by gender in sFas levels
was still significant after controlling for BMI. When sFas levels were plotted
versus the age of the subject, the reason for the high-end hook to the
distribution of normal values became apparent. Both genders exhibited an
age-dependent increase in sFas values with age (Figure 1c and d).
The serum levels of sFasL were determined in the same subjects. The mean value for sFasL was 92.8 ± 21.5 pg/ml. When the distribution of serum
values was analyzed by histogram, a slight hook at the low end was evident
(Figure 2a). Again, the results were stratified by gender to further study the
distribution. Serum levels of sFasL were not significantly different between
genders (Figure 2b and Table 1). Plotting sFasL levels versus the age of the
subject revealed that both genders exhibited an age-dependent decrease in sFasL
values (Figure 2c and d).
While a role for sFas as an
anti-apoptotic factor is accepted in the literature, the pro-apoptotic role of
sFasL is more equivocal [15-18]. A third marker for apoptosis was developed. Cytochrome c release from the
mitochondria is a sentinel signal initiating apoptosis [21] and serum levels of cyt-c
have been used as a marker of apoptosis [22,23].
However, cytochrome c is bound to in serum to leucine-rich alpha-2-glycoprotein-1 which can mask antibody epitopes, potentially
interfering with immunoassay quantification [20]. We developed a quantitative western blot using
purified cytochrome c to generate a standard curve and interpolate unknown
concentrations from serum samples that had been denatured and reduced thereby
disrupting binding complexes and enabling the quantification of total cytochrome c levels (Figure 3).
The mean value for serum
levels of total cytochrome
c was 0.71 ±
0.42 μg/ml. The frequency distribution of serum values was analyzed by
histogram and a nonparametric distribution was evident (Figure 4a). When the
results were stratified by gender, the difference in mean (and median) values
by gender were not significant (Figure 4b and Table 1). Plotting total cytochrome c levels versus the age of the subject revealed that both
genders exhibited an age-dependent decrease in total cytochrome c, though the slopes appeared to be different
(Figure 4c and d).
Because of the nonparametric distribution of these
apoptotic markers, the association of serum levels with donor age was analyzed
conservatively by Spearman nonparametric correlation (Table 1). Significant
correlations of subject age versus serum marker levels were observed. sFas in serum correlated positively with
increasing age among females, among males and among the two combined. In
contrast, FasL and total cytochrome c correlated negatively with age. Segregating serum
samples by gender and by decade of life enabled statistical comparison of
gender values by decade using a nonparametric Mann Whitney test. Between the
ages of 41 and 80, females had significantly lower levels of the anti-apoptotic
marker sFas compared with men (Figure 5a). The serum levels of the potentially
pro-apoptotic sFasL, although higher on average in females, were not
significantly different then those in men over the seven decades (Figure 5b).
The apoptosis marker cytochrome c exhibited levels that were different between men and
women from perimenopausal ages onward (Figure 5c).
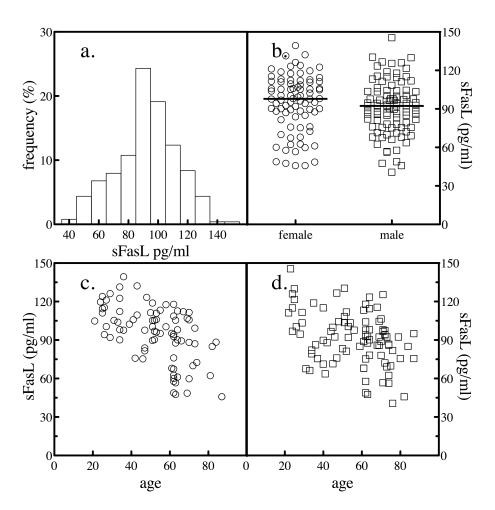
Figure 2. Serum sFasL levels. The levels of sFasL in 204 normal subjects was
determined by sandwich ELSA. The frequency distribution of the values
across the subjects was analyzed (a). The levels of sFasL in all
subjects as a function of gender were plotted (b). The sample
population was segregated by gender and the levels of serum sFasL as a
function of donor age for female (c) and male (d) subjects
were plotted.
The observed shifts in the balance
of pro- and anti-apoptotic factors (sFasL and sFas, respectively) and the
apoptosis marker (cytochrome
c) with age are consistent with decreased
net apoptosis with increasing age. Neoplasm growth and tumor progression rely
in part on blocking apoptosis [24-26]. Serum
from a group of women with breast cancer (n = 66) and men with prostate cancer
(n=38) were analyzed for sFas, sFasL and total cytochrome c and
the distribution of the values compared with age and gender-matched normal
values (Table 2). sFas levels were significantly elevated in both breast and
prostate cancer. In contrast, sFasL and cytochrome c levels were
significantly reduced in both breast and prostate cancer.
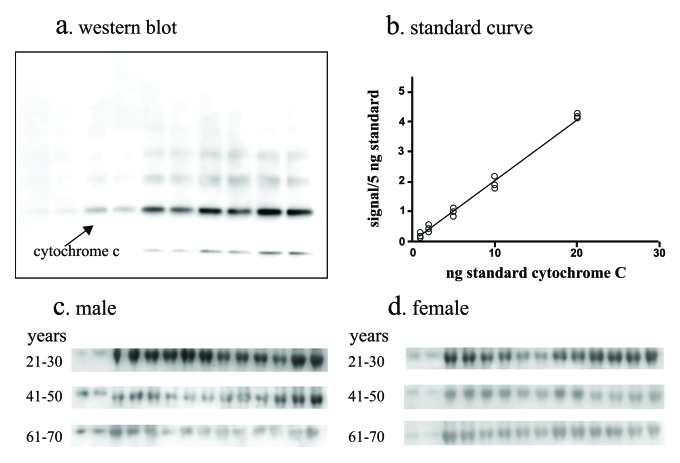
Figure 3. Total cytochrome c assay. A quantitative
western blot assay was developed to measure total cytochrome
c in serum. The assay employed denaturing and reducing conditions to
disrupt cytochrome c binding to carrier
proteins in serum. The assay utilized serial dilutions of purified cytochrome-c resolved by SDS PAGE and western
blotting (a) to generate standard curves (b) by digitally
imaging and quantifying the chemiluminescent signal and serum from men (c)
and women (d) were analyzed in parallel. Standards and serum samples
were analyzed in duplicate.
The association of cancer stage
groupingswith apoptosis markers was investigated for breast and
prostate cancer. The breast cancer serum
values were segregated by stage where stage I is small localized tumors with no
spreading to axillary lymph nodes; stage II disease has larger tumors and
potential spread to the lymph nodes; stage III disease has spread to other
lymph nodes or tissues near the breast; while stage IV is metastatic cancer.
For prostate cancer, stage II cancer is localized within the prostate but
palpable, stage III cancer has broken through the covering of the prostate but
is still regional, and stage IV cancer has spread to other tissues. When the
distribution of sFas, sFasL and cytochrome c were profiled
by stage using Tukey box plots, discrete patterns were observed (Figure 6).
Serum sFas levels increased with
increasing stages of breast cancer (Figure 6a). While stage I disease was not
significantly different from normal, stages II, III, and IV were significantly
elevated relative to the normal. The more advanced stage III disease was
significantly elevated compared to normal and earlier stages, and significantly lower compared to stage IV disease.
Metastatic disease (stage IV) was
significantly elevated compared with all other stages and had a median value
~2-fold higher then normal and stage I breast cancer. Serum sFas levels in
prostate cancer exhibited a similar trend of increasing median values with
increasing stage. However, only stage IV disease was significantly different
from both normal and stage I disease (Figure 6b).
Serum sFasL levels in breast cancer decreased with
increasing stage, with more advanced stages (II, III and IV) significantly
different from normal and stage I (Figure 6c). With prostate cancer, sFasL
levels decreased significantly between normal and stages II, II and IV (Figure 6d). Similarly, serum cytochrome
c levels were significantly reduced
between normal and stages I through IV of breast cancer (Figure 6e) and between
normal and stages II, II and IV of prostate cancer (Figure 6f). Thus, subjects
with cancer have higher anti-apoptotic factors (sFas) in circulation and less
proapoptotic factors (sFasL, cytochrome
c) in circulation. Also, the more
advanced the cancer, the larger the change in circulating levels.
Table 2. Serum levels of apoptosis biomarkers in cancer.
a Age in years ± standard deviation. A subset of the normal female and male groups were age- and gender-matched to the specific cancers.
b Mann Whitney U-test comparing serum values in breast and prostate cancer subjects to age- and gender matched normal subjects.
|
female NL
|
BCA
|
male NL
|
PCA
|
|
n
|
70
|
66
|
40
|
38
|
|
Age
(years)a |
-
|
62 ± 14
|
-
|
66 ± 9
|
|
sFas
(pg/ml)
| | | |
|
mean±SD
|
3585±918
|
5202±1732
|
5023±1309
|
6249±2324
|
|
median
|
3490
|
4831
|
5038
|
5587
|
|
range
|
1603-5877
|
2651-11990
|
3048-8026
|
3462-11580
|
|
U-testb |
p < 0.001
|
p < 0.05
|
|
sFasL
(pg/ml)
| | | |
|
mean±SD
|
94.4±20.1
|
75.3±26.2
|
89.0±19.6
|
69.7±22.0
|
|
median
|
97.3
|
75.2
|
92.2
|
62.2
|
|
range
|
45.9-139.4
|
15.6-125.0
|
40.6-130.3
|
19.4-127.7
|
|
U-testb |
p < 0.0001
|
p < 0.0001
|
|
Cytochrome
c (μg/ml)
| | | |
|
mean±SD
|
0.673±0.266
|
0.27±0.14
|
0.458±0.243
|
0.23±0.09
|
|
median
|
0.601
|
0.24
|
0.406
|
0.21
|
|
range
|
0.239-1.329
|
0.07-0.74
|
0.128-1.039
|
0.09-0.046
|
|
U-testb |
p < 0.0001
|
p < 0.0001
|
Discussion
Apoptosis, originally believed to be a
process with only negative effects, now is recognized to balance the beneficial
potential of eliminating damaged cells against the pathological effects of
deleterious cell death (e.g. neurodegenerative disease) [27]. Failures in apoptosis can contribute to the senescent
cell phenotype as well as rogue cell proliferation [28]. It has been shown that apoptosis is an important cellular
defense mechanism in maintaining genetic stability, and centenarians who have
aged successfully possess cells that are more prone to apoptosis [29]. The major age related disease leading to mortality is
cardiovascular disease. Studies have shown that apoptotic cell death effect
cardiac tissue, and in addition, cells that avoid apoptosis participate in the
progression of atherosclerosis [30,31]. Cancer, another leading cause of mortality, arises from
neoplastic progression through avoidance of apoptosis [32]. In addition, dysregulation of Fas/FasL mediated apoptosis can contribute to the
pathogenesis of pulmonary [33,34] liver [35], and neoplastic [36] fibrosis.
Studies with mice having Fas/FasL mutations suggest
that that a major function of Fas-mediated apoptosis is the elimination of
activated immune cells from the peripheral circulation [37]. Similarly,
humans with autoimmune lymphoproliferative syndrome have mutations in Fas [38,39].
Maintenance of Fas apoptosis signaling is a crucial feature for successful
immune aging [40]. In young
immune fit individuals, stimulation of T cells leads to upregulation of Fas,
FasL, and Fas/FasL engagement-induced apoptosis signaling causing cell death
which eliminates the majority of T cells that are activated in response to a
stimulus, thereby preventing the accumulation of autoreactive T cells. An
age-related impairment of Fas/FasL mediated apoptosis is believed to contribute
to compromised regulation of the immune system and immunosenscence [28]. The age related shift in favor of reduced apoptosis
(higher sFas with lower sFasL and total cytochrome c) may contribute to reduced
clearance of immune cells leading to a state of chronic inflammation [27]. A chronic inflammatory
state may underlie a number of pathologies including cancer [41],
cardiovascular disease [42,43], diabetes mellitus [44], frailty [45,46], osteoporosis [47], rheumatoid
arthritis [48], and
cognitive disorders such as Alzheimers and Parkinson's disease [49-51]. It is of
note that the pro-inflammatory marker interleukin-6
appears to be protective against apoptosis [52-55], its
serum levels are known to increase with increasing age [56] and have an
inverse correlation with Fas-induced apoptosis [57].
In the immune system, Fas and
FasL are involved in down-regulation of immune reactions as well as in T
cell-mediated cytotoxicity [58]. In cancer, malignant cells inhibit the expression of membrane-bound Fas
and express FasL which triggers tumor-infiltrating lympho-cyte apoptotic cell
death [59]. In contrast to their membrane-bound forms,
soluble sFas and sFasL exhibit different
patterns. The levels of sFas and sFasL have been measured independently in separate studies in
different populations of
normal subjects [60,61] and subjects with
breast cancer [62-64] and prostate
cancer [65,66]. Similarly, serum
cytochrome c has
been measured as a marker of apoptotic cell death [19,67] and in cancer [21,68-70]. In general, serum Fas was elevated in cancer
patients while sFasL levels were elevated or reduced, depending on the cancer
group. Interpretation of published results on serum cytochrome
c are complicated by the recent observation that cytochrome c exists in a complex with leucine-rich
alpha-2-glycoprotein-1 in serum which alters immunoreactivity [20]. Thus, it is not
clear whether studies measuring cytochrome c directly in serum are quantifying
a free (unbound) pool or a pool reflecting some combination of free and
complexed cytochrome c. In the current study, levels of 500 ng/ml total cytochrome
c were measured on average in the normal population, which is at least 10-fold
higher then published values [20,71,70].
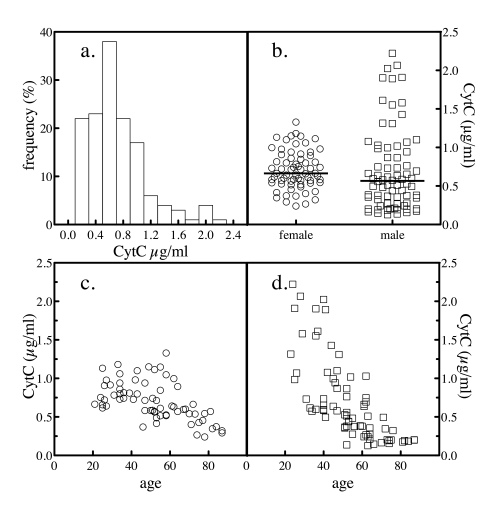
Figure 4. Serum total cytochrome c levels. The levels of
total cytochrome c in 204 normal
subjects were determined as depicted in Figure 3. The frequency
distribution of the values across the subjects was analyzed (a). The
levels of total cytochrome c in all
subjects by gender was plotted (b). The sample population was
segregated by gender and the levels of serum cytochrome
c as a function of donor age for female (c) and male (d)
subjects were plotted.
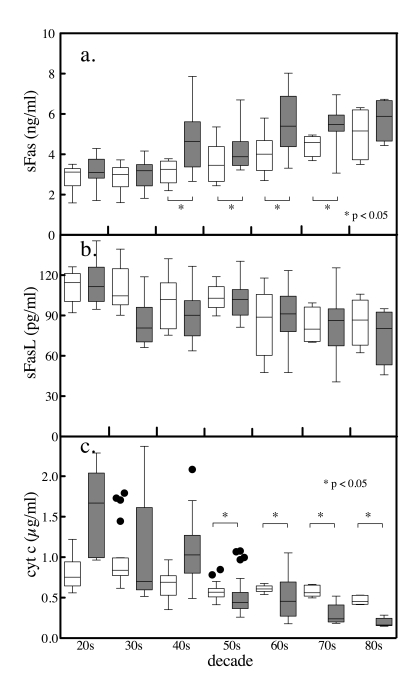
Figure 5. Age and gender differences in serum sFas,. sFasL and total
cytochrome c levels. The serum levels of
the apoptotic biomarkers were segregated by gender and by decade. Tukey box
and whiskers plots (female clear boxes, male shaded boxes) of sFas (a),
sFasL (b) and total cytochrome c
(c) depicting the top, bottom, and line through the middle of the
box correspond to the 75th percentile (top quartile), 25th percentile
(bottom quartile), and 50th percentile (median) respectively. The error
bar-like whiskers depict 1.5 x the interquartile range and the solid
circles represent outliers. Comparisons between genders were performed
conservatively by Mann Whitney U-test.
In a study of 204 clinically
defined normal subjects, serum levels of sFas increased while sFasL and total cytochrome c decreased with increasing subject
age. In addition, the age-related elevation of sFas was significantly higher,
while total cytochrome c was significantly
lower in males from their 40's and 50's onward. This is the first report describing the distribution of these multiple
markers in a single, well-defined normal population. The healthy normal group had extensive
exclusion criteria to minimize confounding due to age-related conditions. Aging is a loss of homeostasis and pathologies traditionally
referred to as age-related diseases (e.g. - cardiovascular disease, cancer,
diabetes, Alzheimer's, osteoporosis) can be considered as manifestations of
fast aging [72]. Given the correlations observed between donor age and the
apoptosis markers in the normal healthy group, the expansion of the study group
to include age-related diseases (whose serum values would reflect fast aging)
might be expected to broaden the differences in these serum markers.
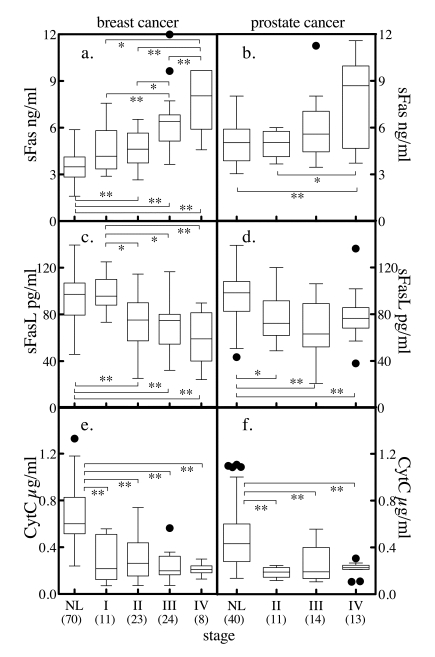
Figure 6. Serum markers of apoptosis and tumor stage. Subjects with
breast cancer (a, c, e), or prostate cancer (b, d, f) were
stratified by stage and the distribution of sFas (a, b), sFasL (c,
d) and cytochrome c (e, f)
stratified by staging was determined. The solid horzontal bars depict the
median values. For breast cancer, stage I tumor size (T) < 2 cm across
and cancer cells have not spread to axillary lymph nodes (N). For stage II,
T < 2 cm across and the cancer has spread to the lymph nodes under the
arm (N positive) or T is 2 to 5 cm and N is negative. In stage III, T >
5 cm or it has spread to other lymph nodes or tissues near the breast.
Stage IV is metastatic cancer. The convention for prostate cancer staging
was that in stage I, cancer is found in the prostate only. In stage II,
cancer is more advanced than in stage I, but has not spread outside the
prostate. In stage III, cancer has spread beyond the outer layer of the
prostate to nearby tissues. Stage IV is characterized by distant
metastasis. Comparison between group median values was performed by Mann
Whitney t-test, where * = p < 0.05, ** = p < 0.005, *** = p <
0.0001. Numbers in parenthesis indicate number of subjects in each group.
The observed shift in the balance to decreased
apoptosis may contribute to age-associated increases in diseases characterized
by failure of normal apoptosis (e.g. - cancer, arthritis, cardiovascular
disease). Indeed, in both breast and prostate cancer, correlative data on serum
sFas, sFasL and total cytochrome
c that were consistent with a shift
toward decreasing apoptosis were also observed in the current study. Finally,
many observations indicate that women have a longer life expectancy than men,
that mortality and morbidity are higher in men than in women and this gender
difference is constant in cardiovascular disease, cancer and dementia [73]. The
observed gender differences in apoptosis markers - higher sFas and reduced
sFasL and total cytochrome
c - which are of indicative of
dysregulated apoptosis would be consistent with the increased mortality and
morbidity in men.
Methods
Subjects.
Approval for the study protocol was
acquired from the local institutional review board and informed consent was
obtained from all patients. Sera from clinically defined normal patients were
obtained from a commercial serum bank (SeraCare Life Sciences Inc., Oceanside,
CA) as well as from the Johns Hopkins Bayview Medical Center General Clinical
Research Center (JHBMC). The JHBMC normal group was obtained from an existing
serum bank using samples from which all patient identifiers were removed. For
this study, inclusion criteria as a normal serum donor included measures within
the normal range for fasting
glucose (< 100 mg/dl),
TSH (0.5 - 2.1 mIU/mL), BMI (20 - 25 kg/m2) as well as a physical
assessment by a physician. Exclusionary criteria included a previous history of
hypertension, heart disease, diabetes mellitus, renal or hepatic dysfunction,
cancer, or any chronic inflammatory condition (e.g., rheumatoid arthritis).
Sera from a group of 104 cancer subjects consisting of 66 females with breast
cancer and 38 males with prostate cancer were obtained from a serum repository. Blood was drawn at time of diagnosis, prior to initiation of
treatment.
Serum biochemical measures.
Blood samples were drawn in the morning
after an overnight fast. Serum biochemical measurements included sFas and sFasL
by sandwich enzyme immunoassay technique (R&D, Systems, Minneapolis, MN).
The assay performance characteristics in the laboratory for sFas were a
sensitivity of 22.4 pg/ml, an intra-assay coefficient of variance of 2.48% and
an inter-assay coefficient of variance of 6.06% and for sFasL were a
sensitivity of 7.2 pg/ml, an intra-assay coefficient of variance of 3.64% and
an inter-assay coefficient of variance of 6.87%.
Total cytochrome c assay.
Cytochrome c protein stan-dard (equine
heart) was obtained from EMD Chemicals (Gibbstown, NJ). A mouse monoclonal
anti-cytochrome c unconjugated antibody was obtained from Invitrogen (Carlsbad,
CA). Goat anti-mouse IgG conjugated to horseradish peroxidase was obtained from
Kirkgaard & Perry (Gaithersburg, MD). NuPAGE 4-12 % Bis -Tris 1.5 mm X 15 well
polyacrylamide gels, NuPAGE antioxidant and See blue pre-stained standards were
obtained from Invitrogen. Super Signal West Dura Extended Duration Substrate
was obtained from Thermo Fisher Scientific Inc. (Waltham, MA).
Serum samples, after being reduced with
10 mM DTT and diluted in gel sample buffer (1:10), were resolved by Nu PAGE
4-12% Bis Tris gel. 8μl of diluted and reduced sample was loaded onto the gel
for each sample. Purified equine heart cytochrome c was used to generate a
standard curve at 20, 10, 5, 2, and 1 ng/well. After electrophoresis, samples
were transferred to nitrocellulose membrane following standard conditions.
After a 1-h incubation in blocking solution (TBS-Tween+5% non fat powdered
milk) at room temperature on rotary shaker, a mouse monoclonal anti-cytochrome
c antibody was added at a dilution of 1: 2000 and incubated over night at 4 c
on a rotary shaker. The nitrocellulose membrane was washed in TBS-Tween three
times for 5 minutes each and then goat anti-mouse IgG conjugated to horseradish
peroxidase diluted to 1:10,000 in TBS-Tween was added and incubated for 2 hrs
at room temperature. Following removal of second antibody solution, the
membrane was washed three times with TBS -Tween and exposed to the
chemiluminiscent enzyme substrate for 5 minutes. Signals were captured,
digitized and analyzed using a Kodak GEL Logic 2200 Imaging System (Carestream
Health Inc., Rochester, NY).
Statistical
analysis.
Comparisons between
groups were performed conservatively using the Mann Whitney nonparametric test.
The association of sFas, sFasL or cytochrome c with donor age was analyzed using
the conservative Spearman nonparametric correlation test. All statistical
calculations were carried out using GraphPad Prism version 5.00 for MacOS (GraphPad
Software, San Diego CA).
Acknowledgments
This research was supported by NIH grants CA87311 and
CA113865 (N.S.F.), Department of Defense grants W81XWH-04-1-0844 and
DAMD17-02-0684 (N.S.F.), and the Johns Hopkins Bayview Medical Center General
Clinical Research Center, NIH/NCRR grant M01RR02719. N.K. was supported by NIH
grant T35 AG-26758, the American Federation on Aging Research and the John A.
Hartford Foundation.
Conflicts of Interest
There is no conflict of interest for any of the authors.
References
-
1.
Muradian
K
and Schachtschabel
DO.
The role of apoptosis in aging and age-related disease: update.
Z Gerontol Geriatr.
2001;
34:
441
-446.
[PubMed]
.
-
2.
Pollack
M
, Phaneuf
S
, Dirks
A
and Leeuwenburgh
C.
The role of apoptosis in the normal aging brain, skeletal muscle, and heart.
Ann N Y Acad Sci.
2002;
959:
93
-107.
[PubMed]
.
-
3.
Adams
JD
, Mukherjee
SK
, Klaidman
LK
, Chang
ML
and Yasharel
R.
Apoptosis and oxidative stress in the aging brain.
Ann N Y Acad Sci.
1996;
786:
135
-151.
[PubMed]
.
-
4.
Sastre
J
, Pallardo
FV
and Vina
J.
Mitochondrial oxidative stress plays a key role in aging and apoptosis.
IUBMB Life.
2000;
49:
427
-435.
[PubMed]
.
-
5.
Kujoth
GC
, Hiona
A
, Pugh
TD
, Someya
S
, Panzer
K
, Wohlgemuth
SE
, Hofer
T
, Seo
AY
, Sullivan
R
, Jobling
WA
, Morrow
JD
and Van
Remmen H.
Mitochondrial DNA mutations, oxidative stress, and apoptosis in mammalian aging.
Science.
2005;
309:
481
-484.
[PubMed]
.
-
6.
Arck
PC
, Overall
R
, Spatz
K
, Liezman
C
, Handjiski
B
, Klapp
BF
, Birch-Machin
MA
and Peters
EM.
Towards a "free radical theory of graying": melanocyte apoptosis in the aging human hair follicle is an indicator of oxidative stress induced tissue damage.
Faseb J.
2006;
20:
1567
-1569.
[PubMed]
.
-
7.
Fraker
PJ
and Lill-Elghanian
DA.
The many roles of apoptosis in immunity as modified by aging and nutritional status.
J Nutr Health Aging.
2004;
8:
56
-63.
[PubMed]
.
-
8.
Kim
R
, Emi
M
, Tanabe
K
, Uchida
Y
and Toge
T.
The role of Fas ligand and transforming growth factor beta in tumor progression: molecular mechanisms of immune privilege via Fas-mediated apoptosis and potential targets for cancer therapy.
Cancer.
2004;
100:
2281
-2291.
[PubMed]
.
-
9.
Gupta
S
Molecular mechanisms of apoptosis in the cells of the immune system in human aging.
Immunol Rev.
2005;
205:
114
-129.
[PubMed]
.
-
10.
Schneider
P
and Tschopp
J.
Apoptosis induced by death receptors.
Pharm Acta Helv.
2000;
74:
281
-286.
[PubMed]
.
-
11.
Sharma
K
, Wang
RX
, Zhang
LY
, Yin
DL
, Luo
XY
, Solomon
JC
, Jiang
RF
, Markos
K
, Davidson
W
, Scott
DW
and Shi
YF.
Death the Fas way: regulation and pathophysiology of CD95 and its ligand.
Pharmacol Ther.
2000;
88:
333
-347.
[PubMed]
.
-
12.
Cheng
J
, Zhou
T
, Liu
C
, Shapiro
JP
, Brauer
MJ
, Kiefer
MC
, Barr
PJ
and Mountz
JD.
Protection from Fas-mediated apoptosis by a soluble form of the Fas molecule.
Science.
1994;
263:
1759
-1762.
[PubMed]
.
-
13.
Papoff
G
, Cascino
I
, Eramo
A
, Starace
G
, Lynch
DH
and Ruberti
G.
An N-terminal domain shared by Fas/Apo-1 (CD95) soluble variants prevents cell death in vitro.
J Immunol.
1996;
156:
4622
-4630.
[PubMed]
.
-
14.
Tanaka
M
, Suda
T
, Takahashi
T
and Nagata
S.
Expression of the functional soluble form of human fas ligand in activated lymphocytes.
Embo J.
1995;
14:
1129
-1135.
[PubMed]
.
-
15.
Kim
JM
, Kim
JS
, Jung
HC
, Song
IS
and Kim
CY.
Apoptosis of human gastric epithelial cells via caspase-3 activation in response to Helicobacter pylori infection: possible involvement of neutrophils through tumor necrosis factor alpha and soluble Fas ligands.
Scand J Gastroenterol.
2000;
35:
40
-48.
[PubMed]
.
-
16.
Serrao
KL
, Fortenberry
JD
, Owens
ML
, Harris
FL
and Brown
LA.
Neutrophils induce apoptosis of lung epithelial cells via release of soluble Fas ligand.
Am J Physiol Lung Cell Mol Physiol.
2001;
280:
L298
-L305.
[PubMed]
.
-
17.
Suda
T
, Hashimoto
H
, Tanaka
M
, Ochi
T
and Nagata
S.
Membrane Fas ligand kills human peripheral blood T lymphocytes, and soluble Fas ligand blocks the killing.
J Exp Med.
1997;
186:
2045
-2050.
[PubMed]
.
-
18.
Mogi
M
, Fukuo
K
, Yang
J
, Suhara
T
and Ogihara
T.
Hypoxia stimulates release of the soluble form of fas ligand that inhibits endothelial cell apoptosis.
Lab Invest.
2001;
81:
177
-184.
[PubMed]
.
-
19.
Abu-Qare
AW
and Abou-Donia
MB.
Biomarkers of apoptosis: release of cytochrome c, activation of caspase-3, induction of 8-hydroxy-2'-deoxyguanosine, increased 3-nitrotyrosine, and alteration of p53 gene.
J Toxicol Environ Health B Crit Rev.
2001;
4:
313
-332.
[PubMed]
.
-
20.
Cummings
C
, Walder
J
, Treeful
A
and Jemmerson
R.
Serum leucine-rich alpha-2-glycoprotein-1 binds cytochrome c and inhibits antibody detection of this apoptotic marker in enzyme-linked immunosorbent assay.
Apoptosis.
2006;
11:
1121
-1129.
[PubMed]
.
-
21.
Renz
A
, Burek
C
, Mier
W
, Mozoluk
M
, Schulze-Osthoff
K
and Los
M.
Cytochrome c is rapidly extruded from apoptotic cells and detectable in serum of anticancer-drug treated tumor patients.
Adv Exp Med Biol.
2001;
495:
331
-334.
[PubMed]
.
-
22.
Ben-Ari
Z
, Schmilovotz-Weiss
H
, Belinki
A
, Pappo
O
, Sulkes
J
, Neuman
MG
, Kaganovsky
E
, Kfir
B
, Tur-Kaspa
R
and Klein
T.
Circulating soluble cytochrome c in liver disease as a marker of apoptosis.
J Intern Med.
2003;
254:
168
-175.
[PubMed]
.
-
23.
Adachi
N
, Hirota
M
, Hamaguchi
M
, Okamoto
K
, Watanabe
K
and Endo
F.
Serum cytochrome c level as a prognostic indicator in patients with systemic inflammatory response syndrome.
Clin Chim Acta.
2004;
342:
127
-136.
[PubMed]
.
-
24.
Pan
H
, Yin
C
and Van
Dyke T.
Apoptosis and cancer mechanisms.
Cancer Surv.
1997;
29:
305
-327.
[PubMed]
.
-
25.
Staunton
MJ
and Gaffney
EF.
Apoptosis: basic concepts and potential significance in human cancer.
Arch Pathol Lab Med.
1998;
122:
310
-319.
[PubMed]
.
-
26.
Reed
JC
Dysregulation of apoptosis in cancer.
J Clin Oncol.
1999;
17:
2941
-2953.
[PubMed]
.
-
27.
Warner
HR
Aging and regulation of apoptosis.
Curr Top Cell Regul.
1997;
35:
107
-121.
[PubMed]
.
-
28.
Hsu
HC
, Scott
DK
and Mountz
JD.
Impaired apoptosis and immune senescence - cause or effect.
Immunol Rev.
2005;
205:
130
-146.
[PubMed]
.
-
29.
Franceschi
C
, Monti
D
, Scarfi
MR
, Zeni
O
, Temperani
P
, Emilia
G
, Sansoni
P
, Lioi
MB
, Troiano
L
and Agnesini
C.
Genomic instability and aging. Studies in centenarians (successful aging) and in patients with Down's syndrome (accelerated aging).
Ann N Y Acad Sci.
1992;
663:
4
-16.
[PubMed]
.
-
30.
Bromme
HJ
and Holtz
J.
Apoptosis in the heart: when and why.
Mol Cell Biochem.
1996;
163-164:
261
-275.
[PubMed]
.
-
31.
Olivetti
G
, Abbi
R
, Quaini
F
, Kajstura
J
, Cheng
W
, Nitahara
JA
, Quaini
E
, Di Loreto
C
, Beltrami
CA
, Krajewski
S
, Reed
JC
and Anversa
P.
Apoptosis in the failing human heart.
N Engl J Med.
1997;
336:
1131
-1141.
[PubMed]
.
-
32.
O'Brien
DI
, Nally
K
, Kelly
RG
, O'Connor
TM
, Shanahan
F
and O'Connell
J.
Targeting the Fas/Fas ligand pathway in cancer.
Expert Opin Ther Targets.
2005;
9:
1031
-1044.
[PubMed]
.
-
33.
Santiago
B
, Galindo
M
, Rivero
M
and Pablos
JL.
Decreased susceptibility to Fas-induced apoptosis of systemic sclerosis dermal fibroblasts.
Arthritis Rheum.
2001;
44:
1667
-1676.
[PubMed]
.
-
34.
Tanaka
T
, Yoshimi
M
, Maeyama
T
, Hagimoto
N
, Kuwano
K
and Hara
N.
Resistance to Fas-mediated apoptosis in human lung fibroblast.
Eur Respir J.
2002;
20:
359
-368.
[PubMed]
.
-
35.
Canbay
A
, Higuchi
H
, Bronk
SF
, Taniai
M
, Sebo
TJ
and Gores
GJ.
Fas enhances fibrogenesis in the bile duct ligated mouse: a link between apoptosis and fibrosis.
Gastroenterology.
2002;
123:
1323
-1330.
[PubMed]
.
-
36.
Peng
Z
, Zhang
Y
, Gu
W
, Wang
Z
, Li
D
, Zhang
F
, Qiu
G
and Xie
K.
Integration of the hepatitis B virus X fragment in hepatocellular carcinoma and its effects on the expression of multiple molecules: a key to the cell cycle and apoptosis.
Int J Oncol.
2005;
26:
467
-473.
[PubMed]
.
-
37.
Crispe
IN
Fatal interactions: Fas-induced apoptosis of mature T cells.
Immunity.
1994;
1:
347
-349.
[PubMed]
.
-
38.
Fisher
GH
, Rosenberg
FJ
, Straus
SE
, Dale
JK
, Middleton
LA
, Lin
AY
, Strober
W
, Lenardo
MJ
and Puck
JM.
Dominant interfering Fas gene mutations impair apoptosis in a human autoimmune lymphoproliferative syndrome.
Cell.
1995;
81:
935
-946.
[PubMed]
.
-
39.
Rieux-Laucat
F
, Le
Deist F
, Hivroz
C
, Roberts
IA
, Debatin
KM
, Fischer
A
and de Villartay
JP.
Mutations in Fas associated with human lymphoproliferative syndrome and autoimmunity.
Science.
1995;
268:
1347
-1349.
[PubMed]
.
-
40.
Herndon
FJ
, Hsu
HC
and Mountz
JD.
Increased apoptosis of CD45RO- T cells with aging.
Mech Ageing Dev.
1997;
94:
123
-134.
[PubMed]
.
-
41.
Aggarwal
BB
, Shishodia
S
, Sandur
SK
, Pandey
MK
and Sethi
G.
Inflammation and cancer: how hot is the link.
Biochem Pharmacol.
2006;
72:
1605
-1621.
[PubMed]
.
-
42.
Osiecki
H
The role of chronic inflammation in cardiovascular disease and its regulation by nutrients.
Altern Med Rev.
2004;
9:
32
-53.
[PubMed]
.
-
43.
Diomedi
M
, Leone
G
and Renna
A.
The role of chronic infection and inflammation in the pathogenesis of cardiovascular and cerebrovascular disease.
Drugs Today (Barc).
2005;
41:
745
-753.
[PubMed]
.
-
44.
Duncan
BB
and Schmidt
MI.
The epidemiology of low-grade chronic systemic inflammation and type 2 diabetes.
Diabetes Technol Ther.
2006;
8:
7
-17.
[PubMed]
.
-
45.
Leng
S
, Chaves
P
, Koenig
K
and Walston
J.
Serum interleukin-6 and hemoglobin as physiological correlates in the geriatric syndrome of frailty: a pilot study.
J Am Geriatr Soc.
2002;
50(7):
1268
-1271.
[PubMed]
.
-
46.
Walston
J
, McBurnie
MA
, Newman
A
, Tracy
RP
, Kop
WJ
, Hirsch
CH
, Gottdiener
J
and Fried
LP.
Frailty and activation of the inflammation and coagulation systems with and without clinical comorbidities: results from the Cardiovascular Health Study.
Arch Intern Med.
2002;
162:
2333
-2341.
[PubMed]
.
-
47.
Ginaldi
L
, Di Benedetto
MC
and De
Martinis M.
Osteoporosis, inflammation and ageing.
Immun Ageing.
2005;
2:
14
[PubMed]
.
-
48.
Wong
SH
and Lord
JM.
Factors underlying chronic inflammation in rheumatoid arthritis.
Arch Immunol Ther Exp (Warsz).
2004;
52:
379
-388.
[PubMed]
.
-
49.
McGeer
PL
and McGeer
EG.
Inflammation and the degenerative diseases of aging.
Ann N Y Acad Sci.
2004;
1035:
104
-116.
[PubMed]
.
-
50.
Perry
CG
, Cleland
SJ
, Connell
JM
, Petrie
JR
and Sattar
N.
Low grade inflammation is notably suppressed by conventional anti-inflammatory treatment: a randomised crossover trial.
Heart.
2004;
90:
804
-805.
[PubMed]
.
-
51.
Wersinger
C
and Sidhu
A.
An inflammatory pathomechanism for Parkinson's disease.
Curr Med Chem.
2006;
13:
591
-602.
[PubMed]
.
-
52.
Biffl
WL
, Moore
EE
, Moore
FA
, Barnett
CC Jr
, Carl
VS
and Peterson
VN.
Interleukin-6 delays neutrophil apoptosis.
Arch Surg.
1996;
131:
24
-29.
[PubMed]
.
-
53.
Bansal
MB
, Kovalovich
K
, Gupta
R
, Li
W
, Agarwal
A
, Radbill
B
, Alvarez
CE
, Safadi
R
, Fiel
MI
, Friedman
SL
and Taub
RA.
Interleukin-6 protects hepatocytes from CCl4-mediated necrosis and apoptosis in mice by reducing MMP-2 expression.
J Hepatol.
2005;
42:
548
-556.
[PubMed]
.
-
54.
Chao
KC
, Chao
KF
, Chuang
CC
and Liu
SH.
Blockade of interleukin 6 accelerates acinar cell apoptosis and attenuates experimental acute pancreatitis in vivo.
Br J Surg.
2006;
93:
332
-338.
[PubMed]
.
-
55.
Malara
N
, Foca
D
, Casadonte
F
, Sesto
MF
, Macrina
L
, Santoro
L
, Scaramuzzino
M
, Terracciano
R
and Savino
R.
Simultaneous inhibition of the constitutively activated nuclear factor kappaB and of the interleukin-6 pathways is necessary and sufficient to completely overcome apoptosis resistance of human U266 myeloma cells.
Cell Cycle.
2008;
7:
3235
-3245.
[PubMed]
.
-
56.
Giuliani
N
, Sansoni
P
, Girasole
G
, Vescovini
R
, Passeri
G
, Passeri
M
and Pedrazzoni
M.
Serum interleukin-6, soluble interleukin-6 receptor and soluble gp130 exhibit different patterns of age- and menopause-related changes.
Exp Gerontol.
2001;
36:
547
-557.
[PubMed]
.
-
57.
Kovalovich
K
, Li
W
, DeAngelis
R
, Greenbaum
LE
, Ciliberto
G
and Taub
R.
Interleukin-6 protects against Fas-mediated death by establishing a critical level of anti-apoptotic hepatic proteins FLIP, Bcl-2, and Bcl-xL.
J Biol Chem.
2001;
276:
26605
-26613.
[PubMed]
.
-
58.
Siegel
RM
, Chan
FK
, Chun
HJ
and Lenardo
MJ.
The multifaceted role of Fas signaling in immune cell homeostasis and autoimmunity.
Nat Immunol.
2000;
1:
469
-474.
[PubMed]
.
-
59.
Abrahams
VM
, Kamsteeg
M
and Mor
G.
The Fas/Fas ligand system and cancer: immune privilege and apoptosis.
Mol Biotechnol.
2003;
25:
19
-30.
[PubMed]
.
-
60.
Seishima
M
, Takemura
M
, Saito
K
, Sano
H
, Minatoguchi
S
, Fujiwara
H
, Hachiya
T
and Noma
A.
Highly sensitive ELISA for soluble Fas in serum: increased soluble Fas in the elderly.
Clin Chem.
1996;
42:
1911
-1914.
[PubMed]
.
-
61.
Ichikura
T
, Majima
T
, Uchida
T
, Okura
E
, Ogawa
T
and Mochizuki
H.
Plasma soluble Fas ligand concentration: decrease in elderly men and increase in patients with gastric carcinoma.
Oncol Rep.
2001;
8:
311
-314.
[PubMed]
.
-
62.
Ueno
T
, Toi
M
and Tominaga
T.
Circulating soluble Fas concentration in breast cancer patients.
Clin Cancer Res.
1999;
5:
3529
-3533.
[PubMed]
.
-
63.
Mullauer
L
, Mosberger
I
, Grusch
M
, Rudas
M
and Chott
A.
Fas ligand is expressed in normal breast epithelial cells and is frequently up-regulated in breast cancer.
J Pathol.
2000;
190:
20
-30.
[PubMed]
.
-
64.
Sheen-Chen
SM
, Chen
HS
, Eng
HL
and Chen
WJ.
Circulating soluble Fas in patients with breast cancer.
World J Surg.
2003;
27:
10
-13.
[PubMed]
.
-
65.
Furuya
Y
, Fuse
H
and Masai
M.
Serum soluble Fas level for detection and staging of prostate cancer.
Anticancer Res.
2001;
21:
3595
-3598.
[PubMed]
.
-
66.
Furuya
Y
, Nagakawa
O
and Fuse
H.
Prognostic significance of serum soluble Fas level and its change during regression and progression of advanced prostate cancer.
Endocr J.
2003;
50:
629
-633.
[PubMed]
.
-
67.
Jemmerson
R
, LaPlante
B
and Treeful
A.
Release of intact, monomeric cytochrome c from apoptotic and necrotic cells.
Cell Death Differ.
2002;
9:
538
-548.
[PubMed]
.
-
68.
Herrmann
PC
, Gillespie
JW
, Charboneau
L
, Bichsel
VE
, Paweletz
CP
, Calvert
VS
, Kohn
EC
, Emmert-Buck
MR
, Liotta
LA
and Petricoin
EF 3rd.
Mitochondrial proteome: altered cytochrome c oxidase subunit levels in prostate cancer.
Proteomics.
2003;
3:
1801
-1810.
[PubMed]
.
-
69.
Barczyk
K
, Kreuter
M
, Pryjma
J
, Booy
EP
, Maddika
S
, Ghavami
S
, Berdel
WE
, Roth
J
and Los
M.
Serum cytochrome c indicates in vivo apoptosis and can serve as a prognostic marker during cancer therapy.
Int J Cancer.
2005;
116:
167
-173.
[PubMed]
.
-
70.
Osaka
A
, Hasegawa
H
, Tsuruda
K
, Inokuchi
N
, Yanagihara
K
, Yamada
Y
, Aoyama
M
, Sawada
T
and Kamihira
S.
Serum cytochrome c to indicate the extent of ongoing tumor cell death.
Int J Lab Hematol.
2009;
31:
307
-14.
[PubMed]
.
-
71.
Hosoya
M
, Kawasaki
Y
, Katayose
M
, Sakuma
H
, Watanabe
M
, Igarashi
E
, Aoyama
M
, Nunoi
H
and Suzuki
H.
Prognostic predictive values of serum cytochrome c, cytokines, and other laboratory measurements in acute encephalopathy with multiple organ failure.
Arch Dis Child.
2006;
91:
469
-472.
[PubMed]
.
-
72.
Blagosklonny
MV
Validation of anti-aging drugs by treating age-related diseases.
Aging.
2009;
1:
281
-288.
.
-
73.
Miniño
AM
, Heron
M
, Smith
BL
and Kochanek
KD.
Deaths: Final data for 2004.
Natl Vital Stat Rep.
2007;
55:
1
-119.
.