Introduction
Background
Parkinson's disease (PD) is a chronic neurodegenerative disorder leading to progressive motor impairment, and affecting more than 1% of the over-65 population [1, 2]; after Alzheimer's disease it is the second most common age-related neurodegenerative disease [3-7]. The neuronal population associated with the motor symptoms of PD is represented specifically by the dopaminergic neurons [8] of the substantia nigra pars compacta [3, 8-10]. Its degeneration leads clinically to progressive motor deficits including bradykinesia, rigidity, resting tremor, and postural instability, as well as a variety of non-motor symptoms in the later stages of the disease [11-14].
Unfortunately, most cases of PD are idiopathic, since their causes are both highly heterogeneous and often unknown [4, 7, 15-19]; further, there is currently no available cure for PD [5, 14]. Genetic studies have shown roles for so-called PARK genes that have been implicated in the disease, especially in the development of the monogenic forms of PD [6, 10, 20, 21]. As well as the genetic component, there is also a great body of evidence that suggests that non-genetic factors may also contribute of the development of PD (e.g. [10, 22-27]. Indeed, it is probable that there is an intimate interplay between genetic and environmental factors, and that the products of PARK genes may be involved in the increased susceptibility of neurons to environmental factors, leading to oxidative stress and (apoptotic) cell death [4, 10, 28-31]. Associated pathophysiology that may be due to both genetic and non-genetic factors may include mitochondrial dysfunction inflammation [32], abrogation of the autosomal-lysosomal autophagy system [33] and endoplasmic reticulum stress [4, 34, 35].
Unsurprisingly, no “one-step” approach alone explains the entire pathophysiology system of PD (e.g. [15, 16]), and therefore Funke and co-workers [10] and Balling and colleagues [36-38] have suggested that a systems biology approach is probably the most sensible way to look at the disease. A focus of in recent PD research is the investigation of biological markers that could help in identifying at-risk individuals or to track disease progression and response to therapies [1, 12], while (notwithstanding the differences between neuroinflammation and peripheral inflammation [39] inflammation is a known hallmark of PD and of many other degenerative diseases [33, 40-42]. In the current work, we therefore focus on inflammatory signalling in PD, using a systems approach that allows us to look at diseases in a more holistic way. Figure 1 shows an overview of the flow of the current manuscript.
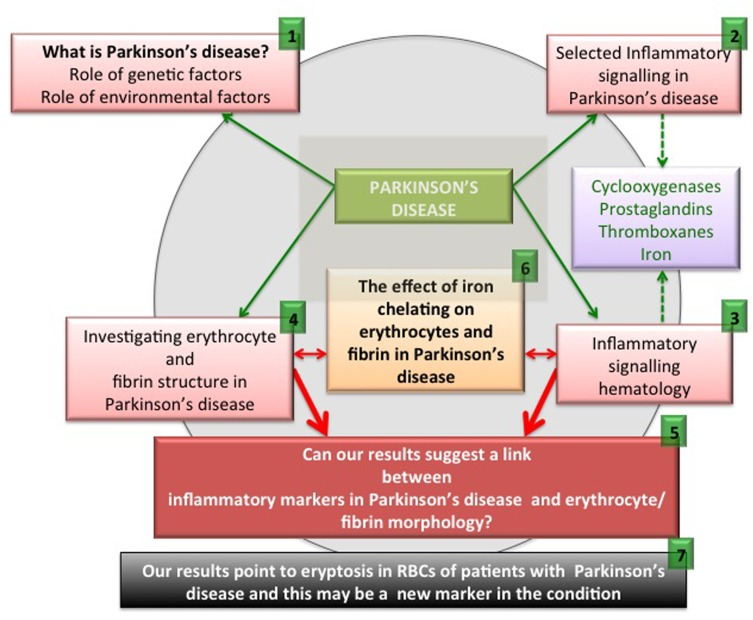
Figure 1. An overview figure summarizing the contents of this manuscript.
As set down in Figure 1, we briefly discuss pathophysiology caused by genetic and environmental factors ((1) in the figure). We also look at selected inflammatory signalling molecules in PD, with a focus on cyclooxygenases, prostaglandins, thromboxanes and also iron (2). It is also well known that these particular signalling molecules that are involved in PD pathophysiology are also very important in an aberrant coagulation/hematology system (3). Therefore, we look at erythrocytes (RBCs) and fibrin networks from 30 PD patients to determine if their RBCs and fibrin networks are changed (4). Lastly, we present and discuss a hypothesis regarding the possible interaction of these aberrant signalling molecules implicated in PD, and suggest that these molecules may affect the coagulation/hematology system of the patients (5). To test this hypothesis further, we investigate the possibility that the iron chelator, desferal, might have an effect on RBCs and fibrin networks in PD (6). Finally, we show that eryptosis occurs in the RBCs of PD patients and that it may be an important marker of the disease (7).
The following paragraphs will look closely at the inflammatory signalling previously implicated in the progression of PD, with a focus on cyclooxygenases, prostaglandins, thromboxanes and iron. As usual, when we refer to ‘iron’ we do not normally specify either its valency or its speciation [43-45].
Inflammatory signalling in Parkinson's disease
Despite the fact that the brain is an immune-privileged site, innate and adaptive immune responses do regularly take place in the brain [40]. While the interplay between inflammation and neuronal dysfunction is complex, there is evidence that chronic inflammation and innate immunity play prominent roles in PD [46], and that peripheral, as well as brain, inflammation contributes to the onset and progression of the neurodegenerative processes seen in PD [39, 47-51]. Thus, serum levels of tumor necrosis factor (TNF) are elevated in PD patients and the serum levels of interleukin-6 (IL-6) correlate with the Hoehn and Yahr staging [42, 46, 52, 53]. PD patients with dementia also showed significantly higher levels of C-reactive protein (CRP) compared to non-demented PD patients (p=0.032) and to the reference group (p=0.026) [54]. Also, CRP and fibrinogen values were found to be higher than in a control group [55].
There is also an increased blood brain barrier (BBB) permeability in PD patients [42, 56-58], as well as cerebral capillary dysfunction [59]. We therefore argue that in PD, a general upregulation of inflammatory signalling may affect both peripheral and brain tissue, resulting in a systemic inflammatory profile, mainly due to the resulting oxidative stress. Figure 2 shows a simpli-fied diagram of how inflammatory signalling can act to be a causal factor for both cardiovascular disease and PD.
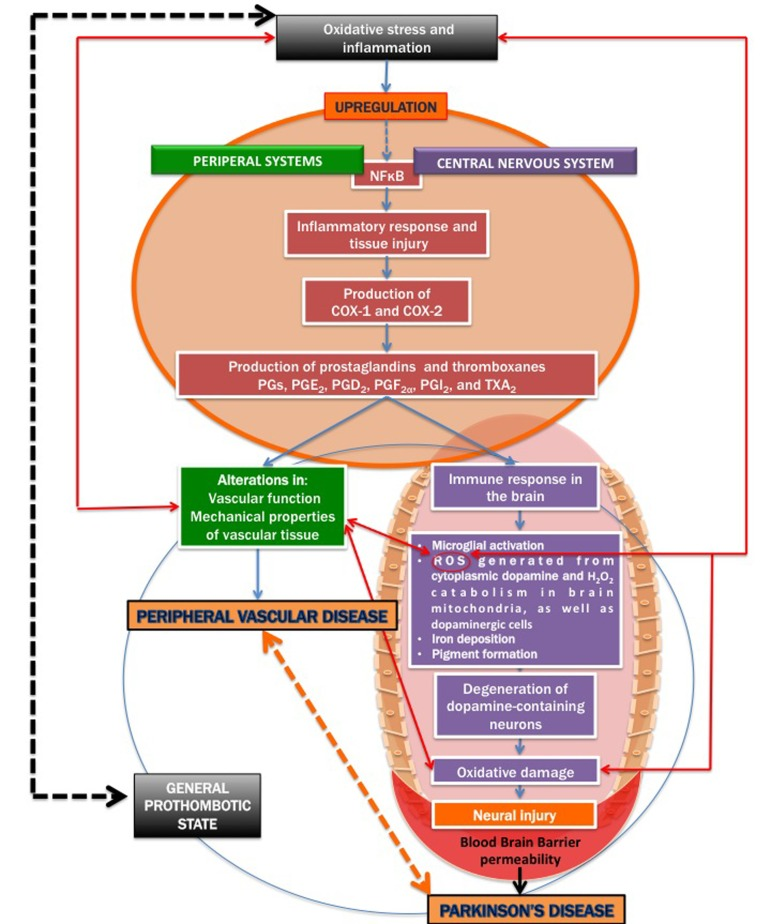
Figure 2. A simplified diagram on how inflammatory signalling contribu tes to both cardiovascular disease and Parkinson's disease.
It is known that severe oxidative stress and inflammation activate the redox-sensitive nuclear transcriptional factor kappa B (NFκB) (e.g. [60-66], resulting in an inflammatory response and tissue injury, including via the production of the cyclooxygenases cyclooxygenase-1 (COX-1) and cyclooxygenase-2 (COX-2) [67-69]. COX-1 and COX-2 are of similar molecular weight, approximately 70 and 72 kDa, and elevated production of prostanoids (the subclass of eicosanoids consisting of the prostaglandins, the thromboxanes, and the prostacyclins) from the constitutive COX-1 or inducible COX-2 is involved in the alterations in vascular function, structure and mechanical properties observed in cardiovascular diseases [68, 70-72].
Inflammation (whether peripheral or neuro-inflammation) may also lead to immune responses in the brain, COX-2 in particular, has also been implicated in neurodegenerative conditions [73-75]. Inducible COX-2 and the constitutively expressed COX-1 catalyze the first committed step in the synthesis of PGs, PGE2, PGD2, PGF2α, PGI2, and TXA2 [68, 76, 77]. COX-mediated neuronal injury is thought to be due to downstream effects of one or more prostaglandin (PG) products, including PGE2, PGD2, PGF2α, PGI2 and thromboxanes (particularly TXA2) that effect cellular changes through activation of specific prostaglandin receptor subtypes and second messenger systems [69, 76, 78].
Prostaglandins are potent oxygenated lipid molecules that contribute significantly to physiologic and pathophysiologic responses, including in the brain [79]. More specifically, PGE2 plays a central role in brain diseases, including in ischaemic injury and in several neurodegenerative diseases [72, 80, 81]. Importantly, PGs are produced in the peripheral systems, but also in resident brain cells [82]. Microglia and astrocytes act as immune cells in the inflamed brain and they both contribute to the onset of inflammation in many brain diseases (including PD) by producing deleterious pro-inflammatory mediators [83-87]. PGs, which are critical mediators of inflammation [68, 72, 80, 88, 89], are largely produced by activated microglia and reactive astrocytes during brain inflammation [90]. However, circulating inflammatory molecules have the ability to target their cognate receptors at the level of the blood-brain barrier; the latter in return is said [91] to produce specific prostaglandins (PGs).
The PGs exercise their effects by activating rhodopsin-like transmembrane-spanning G protein-coupled receptors (GPCRs) [77]. In particular, PGE2, which has been implicated in PD [79], signals through a class of four E-prostanoid (EP) receptors (EP1–EP4) [68, 88]. It has also been shown that, in many neurodegenerative models, the PGE2 EP2 receptor mediates a significant neuro-inflammatory response [68, 89, 92, 93].
Together with the thromboxanes and prostacyclins, the prostaglandins form the prostanoid class of fatty acid derivatives, a subclass of eicosanoids [94]. The thromboxane, TXA2 has prothrombotic properties and is formed from PGH2 by platelets and causes platelet aggregation. An upregulation of thromboxanes (in particular, TXA2) has also been found in PD animal models [95, 96]. As mentioned previously, TXA2 is an eicosanoid and is a lipid signalling mediator [97].
The immune response in the brain leads to microglial activation, elaboration of pro-inflammatory cytokines, the production of reactive oxygen species (ROS) [98], iron deposition [99, 100]; pigment formation [101, 102], and also secondary neuronal injury [68]. Dopamine, via the oxidative stress that it generates in the cytoplasm, could contribute to the selective loss of neurons observed in PD; cytoplasmic dopamine and the resulting ROS therefore is an important damage-pathway in PD [103]. Mitochondrial ROS, particularly imperfect respiration producing H2O2 in brain mitochondria has been implicated in PD [104]. The inflammatory response in the CNS plays a critical role in the pathogenesis of PD [68]. Oxidative damage in particular, plays prominent roles in the degeneration of dopamine-containing neurons [41, 105, 106].
The link between prostaglandins, thromboxanes and iron accumulation in Parkinson's disease
There is extensive evidence that an overload of unliganded iron plays an important role in PD and in related disease such as progressive supranuclear palsy (PSP) [10, 22, 43, 44, 99, 107-141]. Iron is especially high in the substantia nigra, and it is, in particular, the hydroxyl radical produced via Fenton chemistry of the reaction between poorly liganded ferrous iron and hydrogen peroxide that is the chief culprit [142]. There is also evidence for a role of specific iron-dopamine complexes in the aetiology and pathogenesis of PD [43, 44, 138].
There is evidence that serum ferritin levels in PD patient might not be increased [123, 143, 144]. However, in a 2012 study, SF levels were significantly increased in male and female PD patients, and were correlated with Yahr stage and PD duration in men and women [143]. It was also shown that, in PD patients, there might be an accumulation of iron in the brain, which may accelerate free radical formation, lipid peroxidation, and neuronal death, but a reduction in systemic serum iron [145].
The question now arises as to whether increased iron (systemic or in the brain) is associated with the upregulation of COX-2, PGs and thromboxanes. Interestingly, already in 1990, it was suggested that iron overload causes an upregulation of PGs [146]. Literature also suggests a positive correlation between increased SF and prostaglandin PGF2α [147], albeit SF is itself probably an inflammatory biomarker in many cases [45]. Iron overload also enhances the production of arachidonic acid and prostanoid, resulting in an increase in the production of TXA2 [148, 149] and prostacyclin [94].
The above-mentioned inflammatory signalling molecules are not only involved in PD, but are also well known for their participation in aberrant behavior of the coagulation/hematology system. The next paragraphs will discuss their effects specifically on the erythrocytes (RBCs) and on the fibrin network involved in clot formation. In the previous paragraphs, we reviewed the signalling molecules, cyclooxygenases, prostaglandins, thromboxane and iron, and showed their involvement and upregulation in PD. These molecules are also prominently involved in the hematological/ coagulation system. Here we focus specifically on platelets and fibrin, involved in the coagulation cascade, as well as RBCs (for recent reviews see [45, 150-153]. During inflammation, fibrin clot formation is changed [154-157] and this is due to a upregulation in signaling molecules – this will be discussed in the following paragraphs.
Cyclooxygenases (both COX-1 and COX-2) are expressed in platelets and have been widely studied from the perspective of the pharmacological properties of aspirin [158-162]. COX-1-dependent and -independent mechanisms also enhance Platelet-RBC interactions [163]. As mentioned in the previous paragraphs, cyclooxygenases mediate the production of PGs and thromboxanes. Both these signalling molecule groups are also found in platelets. Notably, the TXA2 receptor and PGI2 receptor are found in platelets [164]. Furthermore, PGs are also found in RBCs, these cells express prostacyclin receptor (PGI2) and contain PDE5 [165].
Thromboxanes (particularly TXA2) are produced by activated platelets and have prothrombotic properties and stimulate activation of platelets and increases platelet aggregation [166-169]. This is achieved by inducing expression of the glycoprotein complex GP IIb/IIIa in the cell membrane of platelets [164, 170, 171]. In platelets, TXA2 is generated from prostaglandin H2 by thromboxane-A synthase [172]. Also, the elevation of platelet reactivity by RBCs is likely mediated in part by its capacity to increase platelet TXA2 synthesis, and RBCs modulate biochemical and functional responsiveness of activated platelets [172, 173].
We summarize the above in Figure 3. Increased serum iron (mirrored in serum ferritin [45]) upregulates signalling molecules involved in the hematological/ coagulation system [174, 175]. This causes increased activation, stimulation and reactivity of platelets and a generally enhanced prothrombotic activity, resulting in hypercoagulability. These signalling molecules, including iron, are themselves unregulated in PD, suggesting that there may be a general hypercoagulable state in PD. Part of the purpose of the present work was to test this hypothesis.
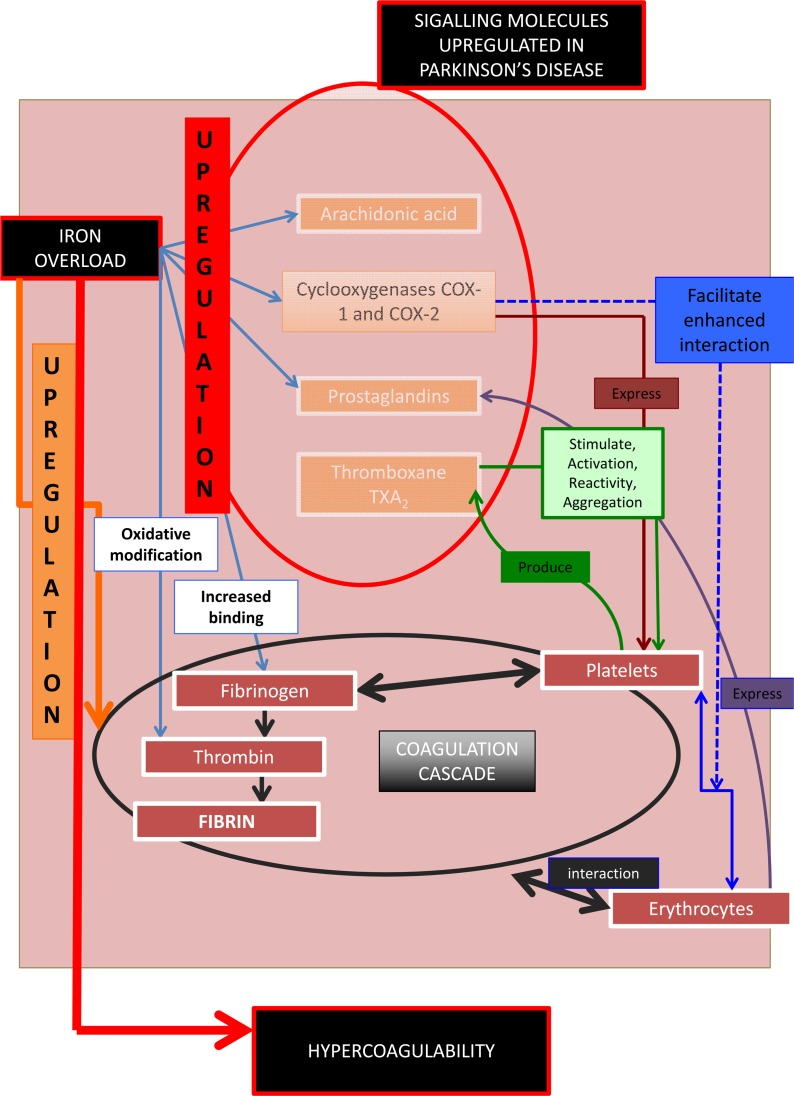
Figure 3. Signalling molecules, their role in the coagulation and hematological system, and their involvement in Parkinson's disease.
Previously (see Table 1) we have shown a changed RBC and fibrin ultrastructure in various inflammatory diseases, in both humans and in animal studies. RBCs lose their shape and become elongated, while fibrin fibre networks become matted and more dense.
Table 1. Some diseases and hypercoagulable states in human and animal models associated with a changed erythrocyte and/or fibrin network structure
| Hypercoagulable state | Cells/structures with ultrastrastructural changes | Reference |
|---|
| Alzheimer's Disease | RBCs and fibrin | [45, 176] |
| Diabetes | RBCs and fibrin | [45, 153, 157, 177-179] |
| Dysfibrinogenemia | Fibrin | [180] |
| HIV/AIDS | Platelets | [181, 182] |
| Hereditary hemochromatosis | | [154, 183] |
| Hypercoagulability due to smoking | RBCs and fibrin | [156, 184, 185] |
| Lupus and Rheumatology | RBCs and fibrin | [45, 186-188] |
| Murine model: Asthma | Platelets and fibrin | [189, 190] |
| Pro-thrombin mutation | Platelets, RBCs and Fibrin | [191] |
| Rabbit model: aspartame | Platelets and fibrin | [192] |
| | |
| Rat model: ischemic stroke: | RBCs and fibrin | [193, 194] |
| Thrombo-ischemic stroke | RBCs and fibrin | [195-201] |
Increases in iron levels play a major role in these conditions. Iron upregulation (in the sense of the release of poorly liganded iron) causes changes in both RBC and fibrin morphology [45, 153, 176, 183]. We have recently shown that added iron may impact on the coagulation profile and RBC ultrastructure [197, 202]. We have also documented that ferric ions can activate non-enzymatic blood coagulation, resulting in the formation of fibrin-like dense matted deposits (DMDs) observable by SEM [155, 203, 204]. Azizova and co-workers also noted that iron causes oxidative modification of thrombin [205]. RBCs also change their morphology under elevated iron levels [206]. All of these changes can be ascribed to the presence of iron, whether by electrostatic means directly, or through its role in the production of hydroxyl radicals (HR) [207-210].
In summary, Figure 3 shows that the prostanoid signalling molecules discussed have effects in both PD and on the haematology/coagulation system. One of the important pathophysiological actions of this upregulation in the haematology/coagulation system is a general state of hypercoagulability. This involves a changed coagulation system due in particular to the effects of thromboxanes on platelets reactivity and increased aggregation, ultimately causing pathologic fibrin formation. The up-regulation of the cyclo-oxygenases, prostaglandins, as well as an increased iron level, result in a general inflammatory profile in both the PD and in the hematology/coagulation system. Therefore these signalling molecules change the coagulation profile to a general hypercoagulable state, well known in PD. The results of epidemiological studies of the relationship between PD and stroke have been conflicting. There is evidence that stroke is not more prevalent in PD patients [211, 212]. However, recently, evidence was presented that the prevalence of stroke in idiopathic Parkinson's disease patients (iPD) is higher than in the general population, and there is also a 2- and 4-fold increased risk of having stroke or transient ischemic attack (TIA) in iPD patients with diabetes and hyperlipidemia, respectively [213, 214].
As the presence of these signalling molecules affects the hematology/coagulation system, we now look closely at one of the most prominent cells in this system, namely the RBC, as it might be an important indicator of inflammation.
Cell death of RBCs: are signalling molecules that are up-regulated in Parkinson's disease possibly implicated in eryptosis?
The signalling molecules discussed in the previous paragraphs and implicated in PD are closely involved in the development of the variant programmed cell death, known as eryptosis, that applies to RBCs [215-219]. Although a PubMed search indicates that eryptosis has not yet been reported in PD, the next paragraphs will argue (and we later show) that eryptosis may indeed be present in PD, due to the changed signalling molecule profiles, and mostly also because it is known that these molecules are also involved in a changed coagulation profile.
Eryptosis is the suicidal cell death of mature RBCs, prior to hemolysis, and is characterized by cell shrinkage, blebbing [216, 218, 219] and membrane scrambling (phosphatidylserine translocation to the outer leaflet of the cell membrane with phosphate-dylserine exposure at the erythrocyte surface) [220]. Triggers of this process include oxidative stress, hyperosmotic shock, hyperthermia, as well as energy depletion [216-219, 221]. The signalling molecules reviewed in this article are involved here and act as triggers that mostly lead to an increased cytoplasmic Ca2+ [222], due to its entry through activated Ca2+ permeable channels. The following processes may happen in RBCs [215-219] (see Figure 4):
Ca2+ may cause phosphatidylserine translocation [223] to the outer leaflet of the membrane with phosphatidylserine exposure at the erythrocyte surface [220]. This results in cell membrane phospholipid scrambling [217].
Activation of Ca2+-sensitive K+ channels, causing the efflux of K+, resulting in a hyperpolarization of the RBC membrane. During this process, Cl− leaves the cell, to assist charge balancing. This loss of KCl results in osmotic water flow, ultimately resulting in cell shrinkage.
Activation of COX-2 followed by PGE2 production, causing activation of Ca2+-permeable non-selective cation channels, causing phospholipid membrane scrambling [217].
Entry of Ca2+ followed by the activation of calpain, a cysteine endopeptidase that degrades membrane proteins, leading to membrane blebbing [218].
Ca2+ sensitivity is enhanced by ceramide, which is another important player in eryptosis. Eryptosis is triggered by hyperosmotic shock, where activation of phospholipase A2 takes place, and this causes platelet activating factor (PAF) release (PAF is formed from cell membrane lipids, by phospholipase). Stimulation of the ceramide-producing enzyme sphingomyelinase, follows this. Ceramide increases the Ca2+sensitivity of the cell, resulting in phospholipid membrane scrambling.
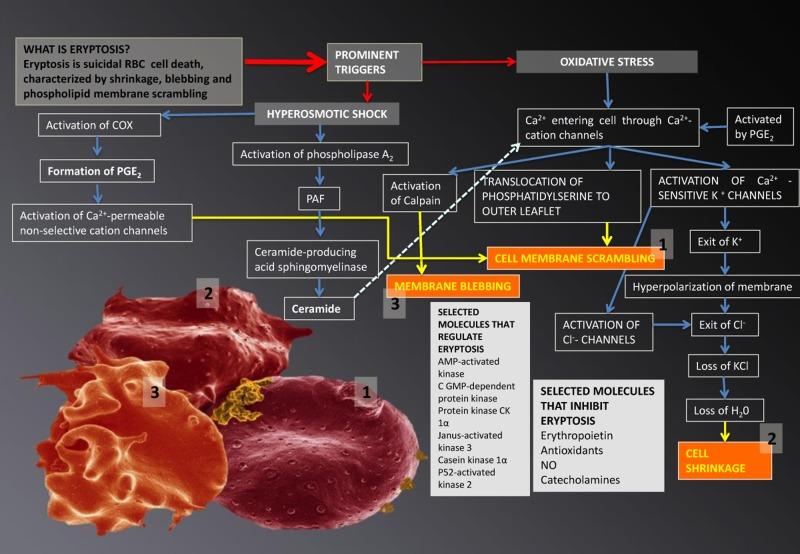
Figure 4. Eryptosis and its signalling molecules: the changes it effects on erythrocytes. Prominent triggers are hyperosmotic shock and oxidative stress. These triggers result in three morphologically visible changes to RBCs and these are phospholipid membrane scrambling (1); cell shrinkage (2) and membrane blebbing (3); when any of these changes are noted in RBCs, the phenomenon is collectively known as eryptosis.
Signalling molecules: eryptosis in Parkinson's disease?
Research suggests that the above-mentioned signaling molecules in eryptosis are also involved in PD. The two signalling molecules that form a critical part in eryptosis, are calpain and ceramide, and the production of both these molecules has been found to be changed in PD [10, 224]. Two recent articles suggest that the calpains play a crucial role in the pathogenesis of PD [225, 226], and calpains are a family of calcium-dependent cysteine proteases that are ubiquitous in mammals and play critical roles in neuronal death [227].
Neurotoxins and alterations in Ca2+ homeostasis have also been associated with Parkinson's disease [228, 229]. In neurodegenerative disorders, cellular Ca2+-regulating systems are compromised, resulting in synaptic dysfunction, impaired plasticity and neuronal degeneration. Alterations of Ca2+-regulating proteins in the plasma membrane (ligand- and voltage-gated Ca2+ channels, ion-motive ATPases, and glucose and glutamate transporters), ER (presenilin-1, Herp, and ryanodine and inositol triphosphate receptors), and mitochondria (electron transport chain proteins, Bcl-2 family members, and uncoupling proteins) are implicated in neurodegenerative diseases [229]. Apoptotic cell death is well-known in PD, and here the endoplasmic reticulum (ER) and the mitochondria are in close communication, establishing a dynamic ER-Ca2+-mitochondria interconnection that can play a prominent role in the neuronal cell death seen in PD pathology [230].
Inhibition of eryptosis may occur mainly due to nitric oxide (which makes the RBCs resistant against increased cytoplasmic Ca2+), and erythropoietin (which inhibits Ca2+-permeable cation channels) [216, 231]. NO disrupts at least in part the effect of Ca2+ on cell phospholipid membrane scrambling [218] and by nitrosylation of enzymes [217]. Accelerated eryptosis is compensated by enhanced erythropoiesis and reticulocytosis [219]. Diseases associated with increased eryptosis (and that is also known for impaired microcirculation as well as a general inflammatory state) include diabetes, sickle-cell anemia, β-thalassemia, glucose-6-phospate dehydrogenase deficiency, malaria, iron deficiency, sepsis, renal insufficiency and hereditary spherocytosis [136, 217-219, 232]. During impaired microcirculation, eryptotic RBCs adhere to the vascular wall, by a mechanism involving phosphatidylserine at the RBC surface and CXCL16, as well as CD36 at the endothelial cell membrane [223]. Patients with PD are also known to have impaired microcirculation [233].
Given all the above, it follows that the possible interaction of these aberrant signalling molecules implicated in PD may affect the coagulation/hematology system, including RBC structure of PD patients (Figure 1(5)). However, there seems very little information available on the functioning of erythrocytes (RBCs) and the coagulation system in patients with PD. Here we therefore investigated the RBCs and fibrin fibre interactions of PD patients by using various microscopy techniques. Given the known and extensive involvement of iron in PD, we also look at the possibility that the iron chelator desferal might have an effect on RBCs and fibrin networks in PD (Figure 1(6)). Iron chelation possibly may protect substantia neurons in animal models of PD [234, 235]; as well as in PD patients [4, 139, 236-241]. In PD, there is an induction of transferrin receptor 2 expression and accumulation of oxidized transferrin inside mitochondria, which results in the release of labile ferrous iron from transferrin and the generation of hydroxyl radicals via Fenton chemistry [4, 242, 243]. Recently, it was suggested [4] that, in the case of PD, there is a need for agents able to appropriately “relocate” iron while at the same time limiting its participation in radical-generating reactions [244]. The iron chelator, de-feriprone, might have such an iron relocating ability [4].
Materials and Methods
Parkinson's patient information
In the current manuscript, 30 healthy and 30 PD patients were studied. The healthy individuals did not smoke, nor use any chronic medication. The 30 PD patients were identified by a Neurologist and the diagnosis of these patients included the use of the Unified Parkinson's Disease Rating Scale (UPDRS). The Hoehn and Yahr scale (see Table 2) was used by the Neurologist to rate the relative level of the PD disability. Margaret M. Hoehn and Melvin D Yahr developed the Hoehn and Yahr scale to scale practically the severity of PD at the time of treatment, and thereby determine whether the medication or treatment that is used influences the rate of the progression of the disease [245]. Many studies thereafter have used this method in scaling the severity of movement disorders [246-250].
Table 2. Relative level of disability and stage of PA: the Hoehn and Yahr scale
| Stage | Symptoms |
|---|
| Stage 0 | No signs of disease |
| Stage 1 | Symptoms on one side only (unilateral) |
| Stage 1.5 | Symptoms unilateral and also involving the neck and spine |
| Stage 2 | Symptoms on both sides (bilateral) but no impairment of balance |
| Stage 2.5 | Mild bilateral symptoms with recovery when the ‘pull’ test is given (the doctor stands behind the person and asks them to maintain their balance when pulled backwards) |
| Stage 3 | Balance impairment. Mild to moderate disease. Physically independent |
| Stage 4 | Severe disability, but still able to walk or stand unassisted |
| Stage 5 | Needing a wheelchair or bedridden unless assisted |
Ethical clearance was obtained from the Health Sciences Ethical Committee of the University of Pretoria and informed consent was obtained from each of the patients as well as from controls (ethical number: 80/2013 under N Vermeulen and E Pretorius). Healthy individuals (individuals who did not smoke, use any medication or have any chronic diseases) also filled in consent forms. Two tubes of blood were obtained from each of these individuals (PD and controls): one 6mL citrate tube and the second 6 mL tube (iron or clotting tube), for serum ferritin (SF) analyses. The SF tests was done to determine whether the the PD patients have an increased SF level. Descriptive statistics for SF levels were calculated using MS-Excel; P values were calculated from the means, the numbers of objects measured in each class and the standard deviations using the Excel add-in available via http://www.talkstats.com/attachment.php?attachmentid=261&d=1213281245 and the facility at http://www.graphpad.com/quickcalcs/ttest1.cfm?Format=SD.
Whole blood (WB) was prepared with and without the addition of thrombin and also with and without the iron chelator desferal (final concentation of WB and desferal was 3.33 mM and WB with desferal and thrombin was 2.5 mM). Desferal was added to WB and left to react for 3 minutes. When thrombin is added an extensive fibrin network is created around trapped RBCs. Desferal was added to WB to determine whether there was a change in RBC shape and fibrin packaging density. These WB preparation methods were done for all microscopy techniques (described in the following paragraphs).
Scanning electron microscopy (SEM)
High magnification SEM analyses were used to look at RBC structure and membrane surface. 10μL of the WB was dropped on a small glass coverslip to make smears with and without the addition of thrombin and desferal (as discussed in previous paragraphs) After the blood was collected, 10 μl of WB with and without 5 μl desferal were placed directly on a glass cover slip, fixed, dehydrated, dried, mounted and coated with carbon according to previously described methods [177]. Also, 10 μl of WB and 5 μl of desferal were mixed with 5 μl of thrombin, to create an extensive fibrin network in between the RBCs. The final concentation of desferal in WB was 3.33 mM and 2.5 mM, when thrombin and WB were also included with desferal. A Zeiss ULTRA Plus FEG-SEM with InLens capabilities was used to study the surface morphology of erythrocytes, and micrographs were taken at 1kV.
Light microscopy (LM)
LM was used to study the axial ratios of erythrocytes (RBCs), using 100x magnification. 10ul of whole blood (WB) (with and without desferal) was used to make a thin smear on a microscopic glass slide, this smear was left for 24 hours to air dry followed by fixing for 5 minutes in 100% methanol and left to air dry for 30 minutes. The smears were stained again for 4 minutes with methylene blue, and rinsed under running water followed by air-drying for 30 minutes. The final staining step involved staining for 30 seconds in eosin and rinsing with running water. Slides were viewed using a Nikon Optiphod transmitted light microscope.
Axial ratios were determined from the LM micrographs, with the use of a program written in the C# programming language. The longest axis from each RBC was determined, referred to as the major axis, after which a perpendicular line was drawn in the centre of the major axis to establish the minor axis length. The axial ratio for each cell was obtained by dividing the major axis length by the minor axis length; a value of 1 represents a perfect circle.
Atomic force microscopy (AFM)
Preparation was done according to previously described methods [176]. Characterization of RBCs with and without the addition of desferal was performed with a commercial AFM system (Dimension Icon with ScanAsyst, Bruker, USA) using the PeakForce QNM (Quantitative Nano-mechanical Property Mapping) imaging mode [251]. At every pixel point a rapid force-distance curve is performed and as the cantilever's deflection sensitivity and spring constant is calibrated before measurements, the curve can be analysed quantitatively to obtain a series of specific property maps of the sample. A retract curve is used to calculate modulus and adhesion images [153, 176, 252], the variation between the zero and maximum force is used to calculate deformation and the area between the approach and retract curve can be used to calculate energy dissipation [253]. Thus, the retract curve is used to calculate modulus and adhesion images (slope of the curve and the minimum of the curve respectively), the variation between the zero and maximum force is used to calculate deformation. The Young's modulus (a measure of the stiffness of an elastic material) was obtained from the slope of the force distance curve of the image using Derjaguin–Muller–Toporov (DMT) Model [153, 254]. Silicon Nitride probes (TAP525 – MPP 13120-10, Bruker, USA) with a nominal force constant of 200 N.m−1, a resonant frequency between 430 and 516 kHz (measured by the manufacturer), and a nominal tip radius of 15 nm were employed in all AFM measurements.
Ten randomly selected cells from each sample were analysed by selecting a 1μm by 1μm scan area on the periphery of the RBC and performing 128 by 128 data points of individual force curve measurements with a peak force of 6 μN. This is an extremely time-consuming analysis and can take up to 8 hours to analyse 10 cells. The periphery of the cells was chosen as there might be differences in concavity of RBCs, and we therefore chose an area that is not affected by the concavity of the specific RBC. The scans were performed at 0.6 Hz, which translates to a tip velocity of 1.2 μm/s and 25 to 35 force curves were chosen randomly within the stated area. Offline software (NanoScope Analysis version R3, Bruker, USA) was used to process the force curves and fit the modulus model to the unloading portion. The goodness of fit (R2) between the modulus model and the data given by the acquired curve is determined by calculating the ratio of explained variation to total variation in the dataset; only force curves with a goodness of fit so defined of 0.85 and above were used for modulus measurements.
The statistical significance of the difference between calculations was determined using one-way analysis of variance. A P value of less than 0.05 relative to the null hypothesis was considered to be ‘significant’ (cf. [255]), and P values are noted.
Results
Table 3 and Table 4 show the demographic information of the PD patients and healthy individuals, as well as their serum ferritin (SF) levels (healthy SF levels for males: 25 – 300 ng.mL-1 and females 25 to 200 ng.mL-1). Table 5 shows the medication profile of the patients, while Table 6 shows the medications used by the PD sample and a review of the literature to determine if the medication itself could possibly have an effect on RBC structure.
Table 3. Parkinson's disease patient (PD) demographic information
Table 4. Healthy individuals demographic information
| No | Gender | Age | SF ng.mL−1 20-250 | Figure number |
|---|
| 1 | F | 45 | 13 | Figure 10A |
| 2 | F | 28 | 24 | |
| 3 | F | 27 | 28 | |
| 4 | M | 24 | 73 | |
| 5 | M | 63 | 48 | Figure 5A to C
Figure 10B |
| 6 | M | 22 | 50 | |
| 7 | F | 55 | 64 | |
| 8 | M | 18 | 29 | |
| 9 | M | 25 | 125 | |
| 10 | M | 34 | 104 | |
| 11 | M | 30 | 156 | |
| 12 | M | 33 | 135 | |
| 13 | F | 25 | 36 | |
| 14 | F | 40 | 21 | |
| 15 | F | 31 | 58 | |
| 16 | F | 56 | 101 | |
| 17 | M | 23 | 62 | |
| 18 | M | 30 | 209 | |
| 19 | M | 23 | 128 | |
| 20 | M | 23 | 116 | |
| 21 | M | 23 | 65 | |
| 22 | M | 23 | 28 | |
| 23 | M | 23 | 109 | |
| 24 | M | 23 | 115 | |
| 25 | M | 23 | 70 | |
| 26 | M | 20 | 83 | |
| 27 | F | 48 | 37 | |
| 28 | F | 23 | 14 | |
| 29 | F | 56 | 65 | |
| 30 | M | 58 | 208 | |
Table 5. Medication used for each Parkinson's disease patient
| Patient ID | Requip | Comtan | Sinemet | Stalevo | Pexola | Madopar | Carbilev | Azilect |
|---|
| 1 | | | √ | | | | | √ |
| 2 | | | √ | | | | | |
| 3 | | | | | | | | √ |
| 4 | √ | | √ | | | | | √ |
| 5 | | | | | √ | | | |
| 6 | | | √ | | √ | | | √ |
| 7 | | | √ | | | | | |
| 8 | √ | | √ | √ | | | | |
| 9 | | | √ | | | | | |
| 10 | | | | | | | | |
| 11 | | √ | √ | | | | √ | |
| 12 | | | | | | √ | | |
| 13 | | | | | | | | |
| 14 | | | | | | √ | | |
| 15 | | | √ | | | | | |
| 16 | | | √ | | | | | |
| 17 | | | | √ | √ | | | |
| 18 | | | | | | | | |
| 19 | | | | | | | | |
| 20 | | | | | | √ | | |
| 21 | | | √ | | | | √ | |
| 22 | | | | | | | | |
| 23 | | | √ | | √ | | | |
| 24 | | | | | | | √ | |
| 25 | | | √ | | √ | | | |
| 26 | | | √ | | | | | √ |
| 27 | | | | | | | | |
| 28 | | √ | | | | | | |
| 29 | | | | | √ | | | √ |
| 30 | | | √ | | | | | √ |
Table 6. Composition of medication and possible association of medication use for Parkinson's disease with erythrocyte changes or damage
| PARKINSON'S DISEASE MEDICATION | WHY IS IT USED? | SELECTED REFERENCES | DOES IT HAVE AN EFFECT ON CARDIOVASCULAR OR ERYTHROCYTE FUNCTION? |
|---|
Ropinirole
(Requip®) | Rotigotine, a non-ergolinic dopamine-receptor agonist, is currently approved as monotherapy in early idiopathic Parkinson's disease in moderate to severe idiopathic restless legs syndrome. | [256-260] | Electrocardiogram
(ECG) abnormalities were found in 40-52% of patients [261]
NO literature available on effect of medication on RBCs and eryptosis. |
| | | |
| Comtan® (entacapone) | Entacapone is an inhibitor of catechol-O-methyltransferase (COMT), used in the treatment of Parkinson's disease as an adjunct to levodopa and carbidopa therapy.
COMT degrades catecholamines such as dopamine.
Levodopa, a precursor of catecholamines, is an important substrate of COMT. COMT inhibitors, like entacapone, save levodopa from COMT and prolong the action of levodopa. Entacapone is a widely used adjunct drug of levodopa therapy. | [262-266] | Entacapone was not associated with an increased risk of acute myocardial infarction, stroke, or death in elderly patients with PD [267].
Entacapone is generally well tolerated, and no significant adverse events are reported [265].
Entacopone induces a dose-dependent inhibition of COMT activity inerythrocytes and a significant decrease in the plasma levels of 3-O-methyldopa, indicating their effectiveness as COMT inhibitors [268].
Entacapone, inhibit dose dependently the COMT activity in erythrocyts [269-271].
NO literature available on effect of medication or COMT inhibition on eryptosis. |
Pramipexole
Pexola® | Pramipexole is a nonergot dopamine agonists. | [272-274] | NO literature available on effect of medication on RBCs and eryptosis. |
Rasagiline
Azilect® | Rasagiline is a selective and irreversible monoamine oxidase (MAO) B inhibitor, which is well tolerated, safe, improves motor symptoms, and prevents motor complications in PD.
Monoamine oxidases are a family of enzymes that catalyze the oxidation of monoamines.
and catalyzes the oxidative deamination of monoamines MAO-B is mostly found in blood platelets. | [275-277] | In 80% patients MAO activity was considerably increased on 3-5 day after stroke [278].
MAO inhibitors appear promising as iron-chelators property [279].
NO literature available on effect of medication on RBCs and eryptosis. |
| COMBINATION DRUGS |
Stalevo®
(carbidopa, levodopa, and entacapone) | Stalevo is an anti-parkinsonian dopaminergic combination medication that contains carbidopa, levodopa, and entacapone for the treatment of Parkinson's disease.
Carbidopa inhibits aromatic-L-amino-acid decarboxylase (DOPA Decarboxylase or DDC). | [280-282] | NO literature available on effect of medication on RBCs and eryptosis. |
| SINEMET® (carbidopa-levodopa) | Levodopa (L-dopa) is the most widely used agent for the symptomatic relief of Parkinson's disease.
Levodopa is the naturally occurring precursor amino acid for dopamine and the main therapeutic agent for neurologic disorders due to dopamine depletion, such as Parkinson's disease.
Levodopa is converted to dopamine via the action of a naturally occurring enzyme, DOPA decarboxylase. | [283-288] | There was no increase in protein-incorporated dopa in erythrocytes [287].
Oxidative activity and specific oxidative activity of ceruloplasmin in serum and the activity of superoxide dismutase (SOD1) were not changed in PD erythrocytes [289]
NO literature available on effect of medication on eryptosis. |
Madopar®
(levodopa + benserazide) | | [290, 291] | NO literature available on effect of medication on RBCs and eryptosis. |
| Carbilev® (carbidopa + levodopa) | Levodopa combined with carbidopa is still the most effective treatment for symptoms of Parkinson's disease. | [292-294] | NO literature available on effect of medication on eryptosis. |
| Amantadine not used by this PD population, but included in this table as it is known for its effect on RBCs | Amantadine is a weak antagonist of the NMDA type glutamate receptor, increases dopamine release, and blocks dopamine reuptake. | [284, 295, 296] | Amantadine (5.0 mM) immediately disordered the packing state of the outer lipid leaflet of membranes [297].
RBCs express N-methyl D-aspartate (NMDA) receptors on their surface, but activation or inhibition of NMDA receptors on RBCs has no influence on their deformability and aggregability [298].
Side effects of amantadine include anemia and exposure of erythrocytes to amantadine increased [Ca2+] and triggered annexin V binding, suggesting that it may cause apoptosis[299].
Amantadine causes fluidization of erythrocyte membranes and inhibits vesicle release [300]. |
Serum ferritin (SF) levels
The pathology laboratory, AMPATH in Pretoria, determined the SF levels of the patients as well as healthy individuals. The SF reference ranges of healthy individuals are taken between 20 and 150 ng.mL-1 for females and 20 and 300 ng.mL-1 for males. Table 3 shows the values for the SF levels of the PD patients, while Table 4 shows the values for the healthy individuals. There were no significant differences between SF levels of healthy individuals and PD patients. This supports selected references that have shown that, systemic SF in PD patients might not be increased [123, 143-145].
Scanning electron microscopy (SEM)
SEM micrographs of WB from both healthy individuals are shown in Figure 5 and PD patients are shown in Figure 6, 7 and Figure 8. Healthy RBCs dropped onto a glass cover slip show a typical discoid shape Figure 5A [45, 153, 176, 183, 191, 199, 301]. When thrombin is added to WB, an extensive fibrin network is formed over and around healthy RBCs, but without changes to the discoid RB C shape Figure 5B. High magnification of membranes, show a smooth membrane architecture Figure 5C. In the current study, we noted that most RBCs from PD patients do not have a typical discoid shape as seen in their axial ratios (see Figure 10C); instead they show typical eryptotic and/or elongated morphology. During eryptosis, the RBCs undergo phospholipid membrane scrambling, shrinkage and blebbing, blebbing that is particularly striking in the WB smears of the PD patients (Figure 6). We have shown previously (Table 1) that high iron levels that occur in various diseases may cause changes in RBC structure, where the cells become elongated (with limited prominent blebbing). This elongation was noted in a large fraction of the RBCs of high-SF Alzheimer's individuals (AD) [176], as well as in the hereditary iron overload disease, haemochromatosis (HH) and in individuals with high SF (HF individuals), but without the HH mutation [154]. In AD individuals with SF levels within the normal ranges, the RBC structure was not changed. In these high iron conditions (often correlated with high SF [45]), RBCs have an elongated, non-discoid RBC shape. These elongated shape changes are also induced when physiological levels of iron are added to healthy whole blood [199, 202, 204, 206].
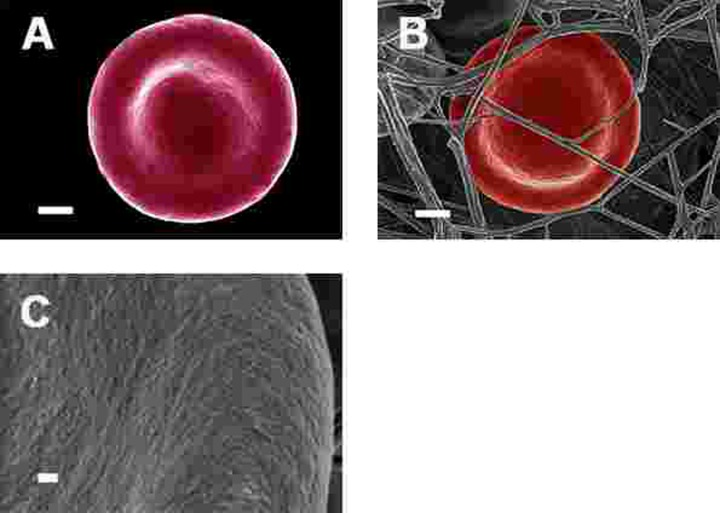
Figure 5. Representative erythrocytes of healthy individuals prepared from whole blood smears. Serum ferritin = 48 ng.mL−1 (A) Erythrocyte prepared from whole blood without thrombin; scale = 1μm; (B) Erythrocyte prepared from whole blood with added thrombin to create extensive fibrin fibre network around erythrocytes; scale = 1μm; (C) High machine magnification of 150,000x showing erythrocyte membrane, scale bar = 100 nm.
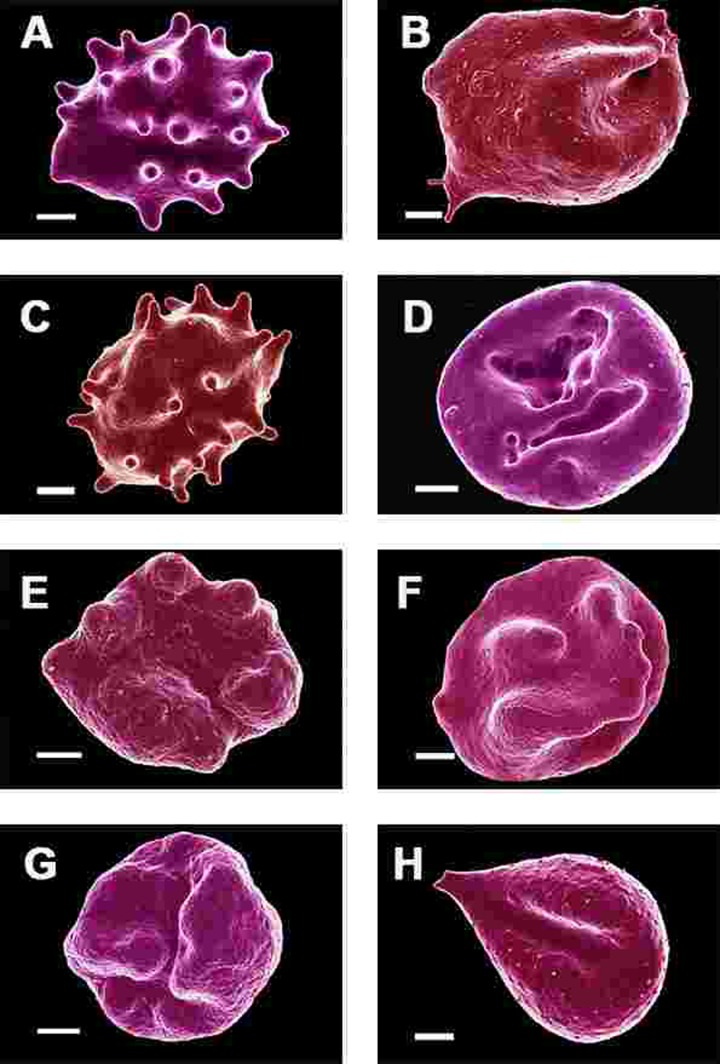
Figure 6. Erythrocytes of Parkinson's disease patients prepared from whole blood smears. Serum ferritin levels: (A) 80 ng.mL‐1 (B) 194 ng.mL‐1 (C) 90 ng.mL‐1 (D) 90 ng.mL−1 (E) 145 ng.mL‐1 (F) 358 ng.mL‐1 (G) 145 ng.mL‐1 (H) 21 ng.mL−1 Scale bar = 1μm.
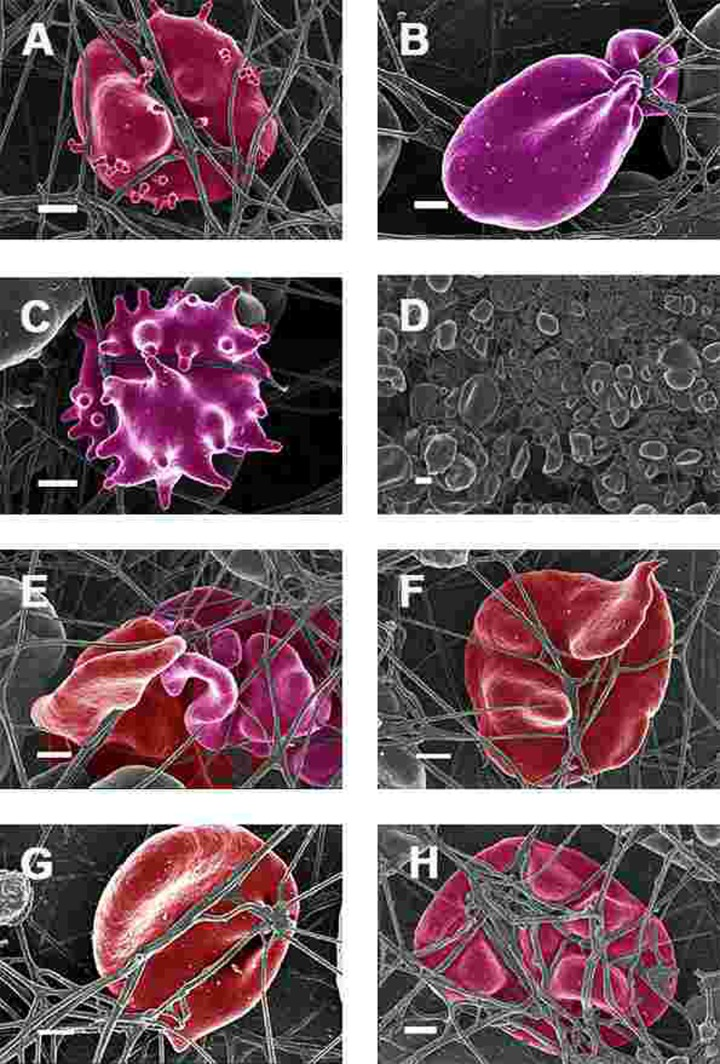
Figure 7. Erythrocytes of Parkinson's disease patients prepared from whole blood with added thrombin. Serum ferritin levels: (A) 118 ng.mL−1 (B) 194 ng.mL-1 (C) 21 ng.mL-1 (D) 107 ng.mL−1 (lower machine magnification to show general SEM view of erythrocytes) (E) 145 ng.mL−1 (F) 358 ng.mL-1 (G) 372 ng.mL-1 (H) 90 ng.mL-1 Scale bar = 1μm.
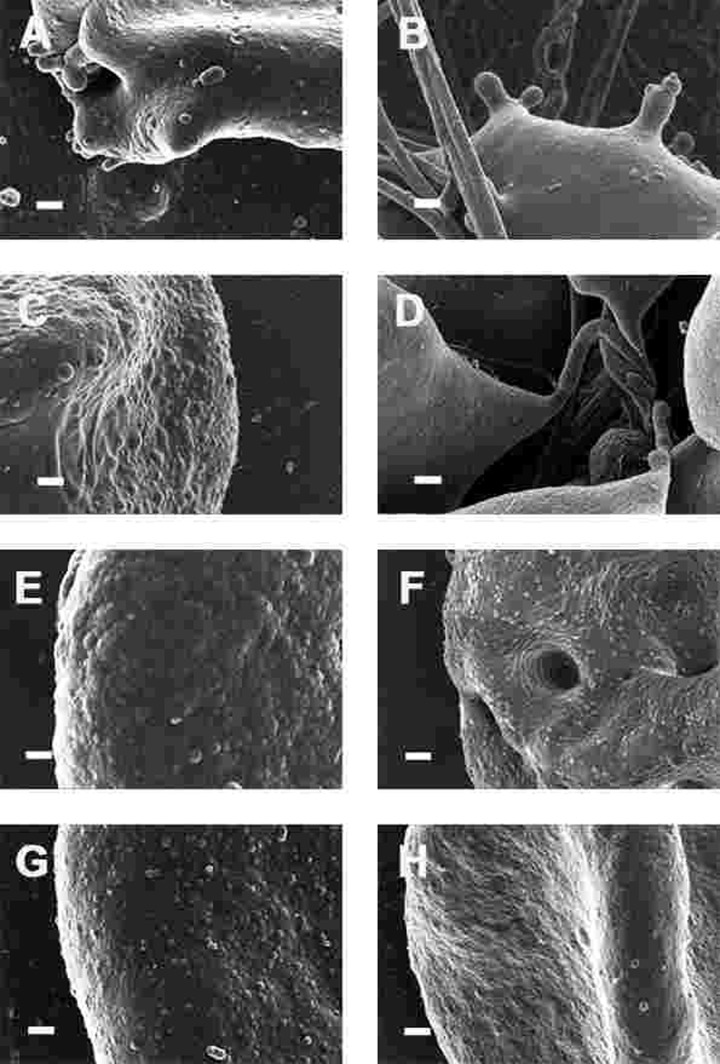
Figure 8. High magnification (100,000x machine magnification) of erythrocyte membranes of Parkinson's disease patients prepared from whole blood. Serum ferritin levels: (A) 194 ng.mL−1 (B) 118 ng.mL−1 (C) 90 ng.mL−1 (D) 21 ng.mL−1 (E) 281 ng.mL−1 (F) 145 ng.mL−1 (G) 372 ng.mL−1 (H) 358 ng.mL−1 Scale bar = 200 nm.
In the current study, 24 of the 30 patients have SF values in the normal ranges. However, in all 30 individuals, including the patients with both normal and high SF levels, a changed (eryptotic) RBC structure was noted in most of the cells (See Figure 6 and Figure 10C for RBCs of PD patients, with their SF levels indicated in the legend).
When thrombin was added to WB, RBCs of PD patients folded and became entrapped in the fibrin fibre net (see Figure 7). In the patients with SF in the normal ranges, no changes fibrin fibre networks were noted, and were very similar to the fibrin nets of the controls (see Figure 5). While the numbers of cells shown in the SEM analyses are limited, similar findings were observed in both SEM and LM analysis. To give an indication of a typical SEM view on low magnification, Figure 7D shows the typical morphology of many RBCs entrapped in the fibrin.
This trapping was also previously noted in individuals with high SF diagnosed with Alzheimer's disease, hereditary hemochromatosis and hyperferritinaemia individuals [154, 176]. However, in PD, irrespective of SF levels, RBCs were non-discoid and folded around fibrin fibres (Figure 7). Figure 8 shows high magnification micrographs of the RBC membranes from a series of PD patients. Membrane ultrastructure appears much more rough and textured than that of healthy RBCs (in Figure 5C). We suggest that this is due to membrane phospholipid scrambling, associated with eryptosis [216-219, 302]. Here also, phospholipid membrane scrambling occurs in both high and normal SF level PD patients (Figure 8).
We also studied the effect of the iron chelator desferal on RBC shape and membrane structure. Desferal is the classical clinically approved iron chelator; however, it has poor gastrointestinal absorption and therefore has to be administered intravenously or subcutaneously [303-305]. WB from PD patients with added desferal are shown in Figure 9 (all micrographs in left column are low magnifications while the micrographs in the right columns are the respective 100,000x machine magnification of the same individual's erythrocyte membranes). Desferal is an effective, hexadentate iron chelator and we have previously shown that when added to WB of HH and HF individuals, or of samples treated with free iron, it facilitated a shape change, where the RBCs reverted back to a more discoid shape. Here, we also noted a change to a more discoid shape; however, the gross shape changes were not as prominent in PD patients as was previously noted in HH and HF individuals [154]. This said, a very interesting observation at 100,000x magnification was that the membranes did revert to a smoother topography, suggesting that the desferal did have a stabilizing effect on RBC structure.
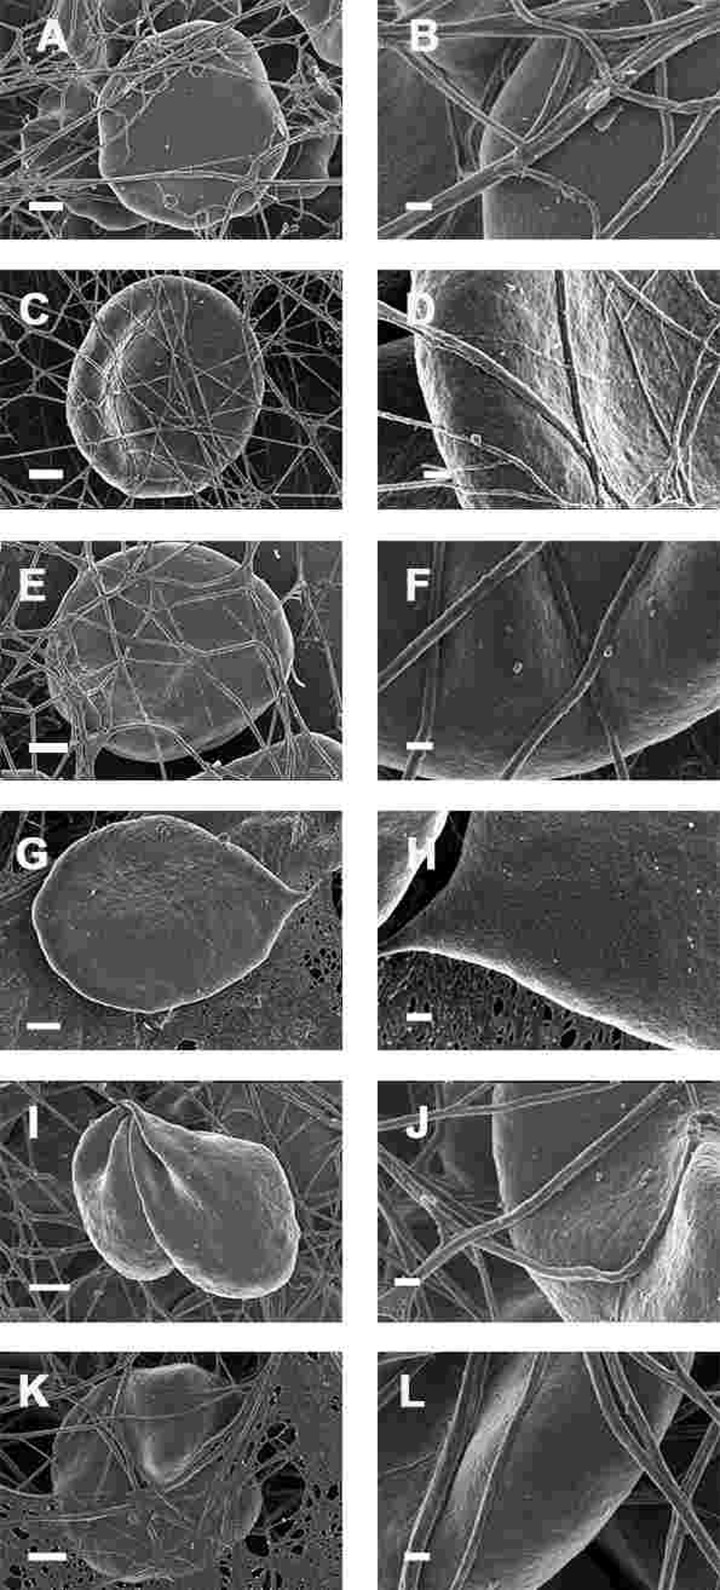
Figure 9. Whole blood of Parkinson's disease patients treated with desferal with added thrombin. All micrographs in left column are low magnifications while the micrographs in the right columns are the respective 100,000x machine magnification of the same individual's erythrocyte membranes. Serum ferritin levels: (A) and (B) 107 ng.mL−1 (C and D) 36 ng.mL-1 (E and F) 90 ng.mL−1 (G and H) 145 ng.mL−1 (I and J) 156 ng.mL−1 (K and L) 358 ng.mL−1 Low magnification scale bar = 1μm; high magnification scale bar is 200 nm.
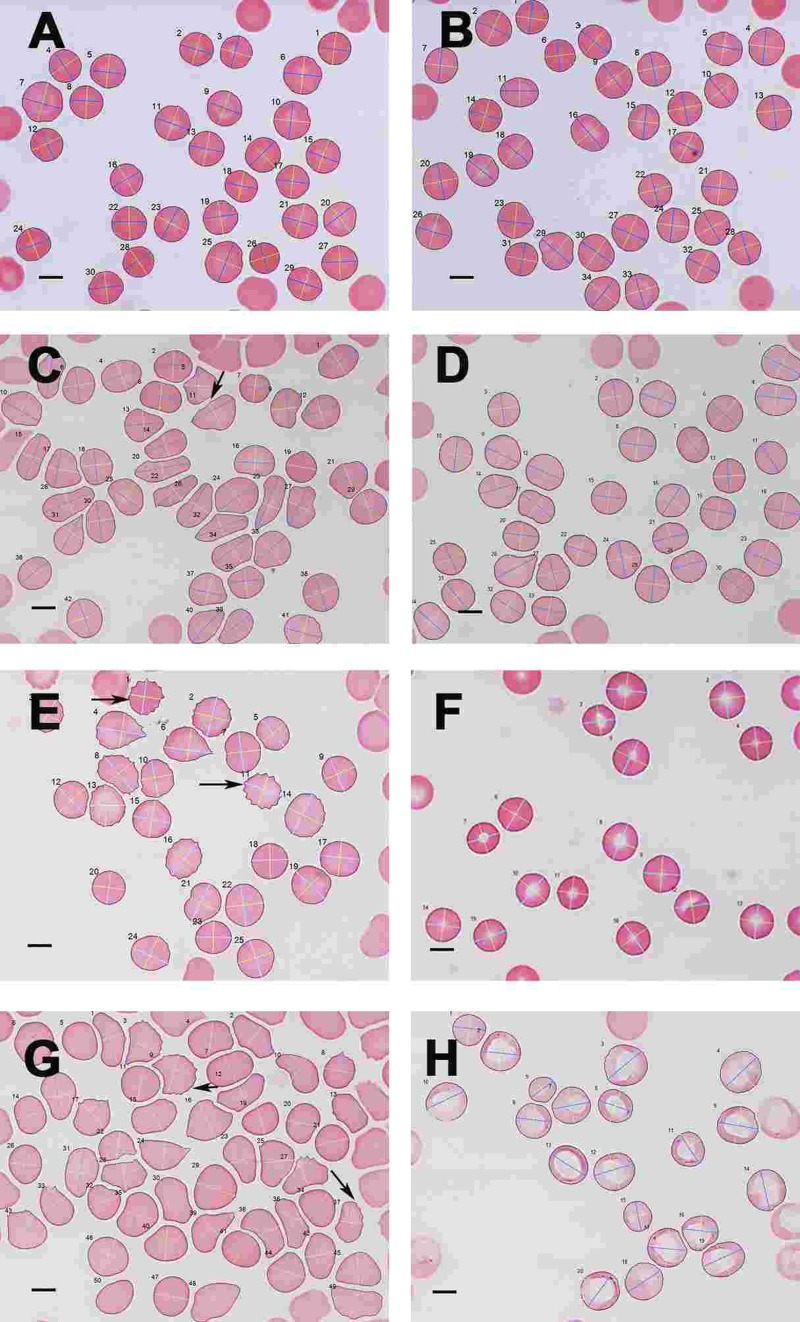
Figure 10. Light microscopy micrograph of whole blood smears from (A) a healthy individual (serum ferritin: 13 ng.mL-1) and (B) a healthy individual, (serum ferritin: 48 ng.mL−1) (C) a female PD individual (serum ferritin: 152 ng.mL−1) and (D) the same PD individual after treatment with desferal; (E) a male PD individual (serum ferritin: 21 ng.mL−1) and (F) the same PD individual after treatment with desferal; (G) a female PD individual (serum ferritin: 568 ng.mL−1) and (H) the same PD individual after treatment with desferal. Major and minor axes indicated on the RBCs, as determined by the C# program written for the analysis. Scale bar = 5 μm.
Light microscopy (LM)
As SEM micrographs showed that most RBCs have a changed shape, micrographs of whole blood smears were taken using LM, to determine for much larger numbers of cells if there was a statistical difference in axial ratios between healthy RBCs and RBCs from PD patient Figure 10 C). Figure 10 A and B show a typical LM smear of a healthy individual with the major and minor axis as determined by the C# program, while Figure 10 C and D; E and F and G and H show micrographs from PF individuals before and after desferal treatment. In SEM analysis, we noted a definite change in some of the PD patients, when desferal was added to their whole blood; therefore axial ratios before and after desferal addition was also analyzed statistically. Table 7 shows the total number of cells analyzed for each group along with the group's average axial ratio and standard deviation. The p-values were determined with Student's t-test. A significant difference was found between the axial ratios of the RBCs of healthy individuals and those from both the PD and PD + desferal groups (p-values of 5.5 X 10⁻⁶ and 0.0006 respectively). No significant difference was found between PD and PD + desferal (p-value of 0.68). Previously we determined axial ratios of 20 cells per healthy individual, using a manual measuring method [154]. In this analysis the average axial ratio was 1.05. In the current analysis where many more cells were analysed per individual, the average healthy RBC axial ratio was 1.13.
Table 7. Average axial ratio and total number of cells analysed for healthy individuals, individuals with Parkinson's disease (PD) and these individuals treated with desferal
| Healthy individuals (N=30) | PD Individuals (N=30) | Blood from PD individuals treated with desferal (N=6) |
|---|
| Total number of cells analysed | 2531 | 2409 | 1848 |
| Average | 1.13 | 1.18 | 1.17 |
| Standard deviation | 0.09 | 0.11 | 0.08 |
A summary of all the light microscope data appears in Figure 11, that also encodes gender, time with disease and Hoehn-Yahr grade.
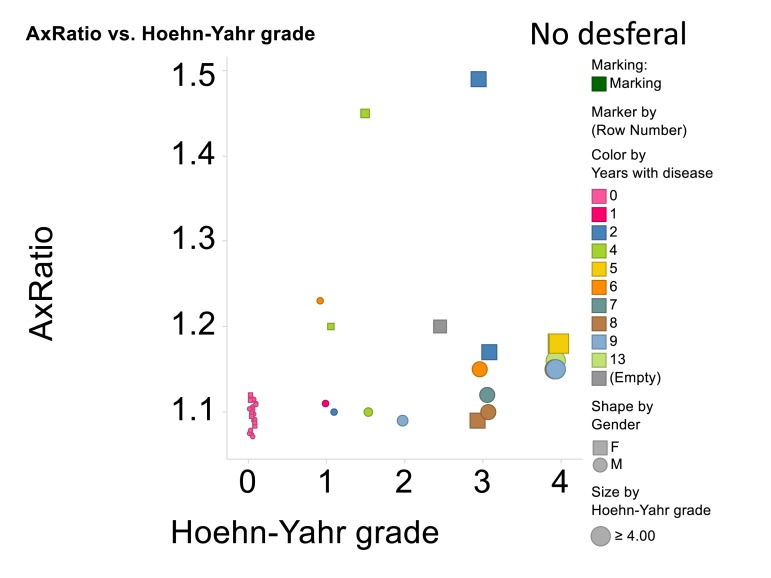
Figure 11. Relationship for all cases and controls between 3ratio and Hoehn-Yahr grade. No desferal was added. “Empty” means that these data on years with disease were not recorded.
Atomic force microscopy (AFM)
Elastic modulus calculations (Table 8) acquired from force-distance curves showed an increase in the Young's modulus of RBC's from patients suffering from Parkinson's disease when compared to RBC measurements from control subjects (51821 and 46711 MPa respectively); this increase of Young's modulus reflects a decrease in the elasticity of the cell membrane. A subset of the PD patients (6) showing elevated high iron levels were treated with the chelator desferal. Elasticity measurements before and after treatment showed a decrease in the Young's modulus of roughly 3000MPa after treatment (see Table 8), indicating a certain amount of recovery of cell membrane elasticity. These results can be visualized in force-distance curves (Figure 12), where a representative curve from an RBC from a patient with PD is compared to a curve from a healthy individual's RBC; a steeper slope can be seen for the healthy individual (Figure 13A) and a curve from a desferal-treated RBC (Figure 13B) shows a slightly flatter curve and increased displacement than a curve from an RBC not treated with desferal.
Table 8. Descriptive statistics for elasticity of red blood cell (RBC) membranes
| Mean | Standard Error | P value | N Individuals | N Cells | N Curves |
|---|
| PARKINSON'S (PD) | 51821 | 846 | 0.0025 | 26 | 260 | 10376 |
| CONTROL | 46710 | 749 | 11 | 110 | 2737 |
| | | | | | |
| PD WITH HIGH SF BEFORE DESFERAL | 56257 | 1018 | 0.0457 | 6 | 60 | 3029 |
| PD WITH HIGH SF AFTER DESFERAL | 53056 | 1626 | 6 | 60 | 2073 |

Figure 12. Representative force-distance curves obtained on erythrocytes from healthy individuals, individuals suffering from Parkinson's disease, individuals suffering from Parkinson's disease with high serum ferritin and the same individuals suffering from Parkinson's disease with high serum ferritin after treatment with desferal.
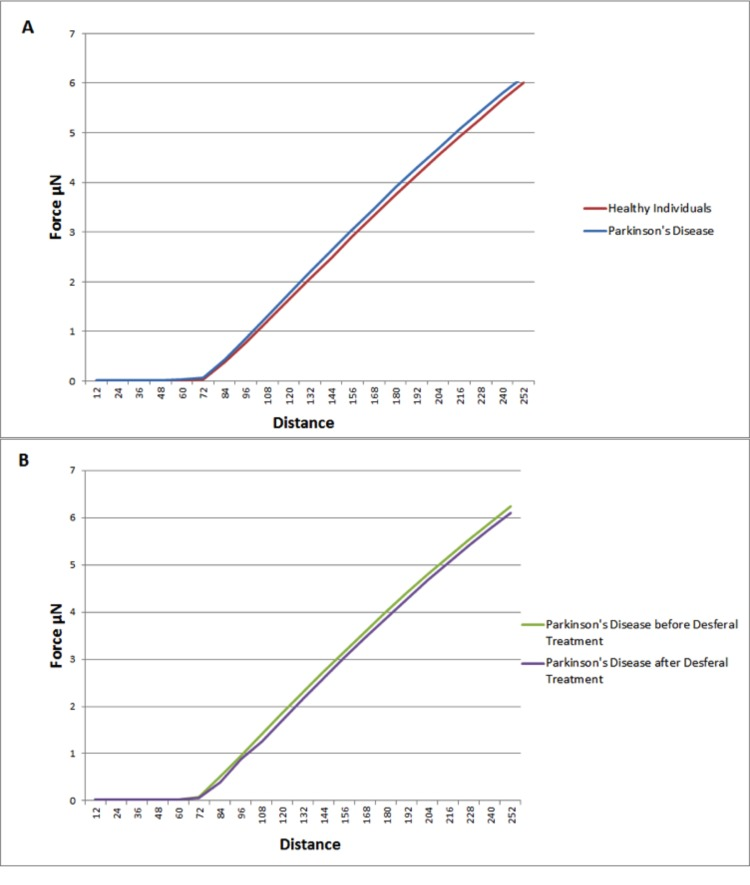
Figure 13. Representative force-distance curves showing the difference between: (A) Healthy individuals and individuals suffering from Parkinson's disease. (B) Individuals suffering from Parkinson's disease with high serum ferritin and the same individuals suffering from Parkinson's disease with high serum ferritin after treatment with Desferal. Force-Distance curves show the atomic force microscope (AFM) cantilever deflection range on the cell surface.
Discussion
In the introductory paragraphs of this manuscript we pointed out that the signaling molecules associated with the presence of neuro-inflammation, seen in PD individuals are the same as those that are typically associated with cardiovascular inflammation [12, 33, 40, 42, 46, 69, 75, 88, 106, 306, 307] (see Figure 2 and Figure 3). We also argued that, when we look closer at eryptosis, the most common cell death mechanism of RBCs, the same signaling molecules implicated in PD is involved in eryptosis [215-219] (see Figure 4). Particularly, the two signalling molecules calpain and ceramide, that are prominently involved in eryptosis, are also implicated in PD [10, 224-226], and (particularly calpain) play critical roles in neuronal death [227].
This evidence that is presented from reviewing the literature, suggests that there is a case for looking closely at the RBC structure in PD individuals. Previously, it was shown that an increased red blood cell distribution width (RDW) is a strong predictor of mortality in the general population of adults 45 years or older [308]. Also, it was recently suggested that cytometric analysis of cell size and heterogeneity of size could be used as a potential biomarker [309].
In the current manuscript, we therefore looked at the ultrastructure of RBCs of PD patients, and noted that in whole blood smears, RBCs have a changed shape, and that most of the RBCs have a typical eryptotic shape (see Figure 6) and light microscopy smear of healthy individuals and PD individuals (see Figure 10 A to H). Axial ratios of healthy RBCs are 1.13 (see Table 7), where that of PG individuals have an average of 1.18. In the presence of thrombin (see Figure 7), RBCs are trapped in fibrin fibers that twist around the aberrantly-shaped RBCs. Very high SEM magnification (see Figure 8), showed that membranes of these RBC are much more granular than in those found in healthy RBCs (see Figure 5C). AFM analyses showed that there were significant differences in the membrane elasticity of PD individuals compared to that of healthy individuals. This confirms the possibility that phospholipid membrane scrambling is present in the PD RBC membranes.
In the current PD group the systemic SF levels were also mostly in the normal ranges, and although there were individuals with increased SF levels, we could not distinguish between the RBCs from normal versus high SF PD individuals. This differs from what we found in Alzheimer's individuals, where RBCs of patients with normal SF levels, looked similar to healthy individuals, but individuals with high SF levels had a changed ultrastructure and elasticity as seen with AFM [176]. There is therefore no specific relation between increased SF levels and aberrant RBC ultrastructure here, as all PD RBCs have a changed morphology (irrespective of SF level). This might be due to the major inflammatory nature of the condition. Previously, we showed that, when there is an increased systemic SF, such as in Alzheimer's disease and hereditary hemochromatosis, fibrin fibre morphology was also changed. The fibrin fibers formed thick and matted deposits and we suggested that it might be due to the oxidative stress as a result of the increased systemic SF or iron levels [176]. In the current sample, the fibrin fibres of the PD group with SF levels within the normal ranges did not show a denser fibrin fibre net. This might be due to the absence of increased systemic iron levels. We might therefore assume that the changed RBC shape seen in all the PD patients might be due to the upregulation of the inflammatory markers discussed in the previous paragraphs, and that the iron plays a less prominent role.
However, because of the established involvement of increased SF in PD [22, 111, 112, 116, 119, 122, 123, 129, 134-137], we looked at whether the iron chelator desferal might have an effect on the RBC structure of our PD sample. No statistically significant effect was noted. This might be taken to indicate that under the chronic conditions of PD the effects of iron are due more to Fenton chemistry than to electrostatics [45, 153, 154], and that up-regulated inflammatory markers may play a more prominent role in the changed RBC structure, than iron (SF).
We conclude by suggesting that PD should be treated not only as a neuro-inflammatory and neuro-degenerative condition because of the observable peripheral effects. There is striking evidence from the literature that suggests that PD patients might also have general cardiovascular inflammation [306, 307], and that this might lead to a general ill health of the patients. RBC morphology may be developed as markers that might reflect the severity and prognosis of PD in these patients. The heterogeneity of the RBC population appears to be a prognostic marker of aging/longevity and it is suggested that the RDW. Therefore, RDW may be another marker that may change with progression of PD. RDW is measured by flow cytometry on a population of 10,000 or more cells and therefore this use of this parameter should be investigated further. In particular, assessment of the RBC structure may be a simple diagnostic test for the impact of treatment regimes, and iron chelators may have a role to play in treating this very debilitating condition. Overall, we recognise that PD may have multiple causes and act via multiple pathways [10]. The fact that it can be mimicked, to some degree, by a variety of toxins [310], is consistent with the idea that there may be environmental triggers. We note too that iron chelation can prove effective in such models, too [237, 311-315].
We thank the Biotechnology and Biological Sciences Research Council (grant BB/L025752/1) as well as the National Research Foundation (NRF) of South Africa for supporting this collaboration.
None of the authors has any conflict of interest to declare.