Evolutionary dynamics and population history
The entire Italian dataset (i.e. centenarians and controls) was first submitted to ADMIXTURE analysis (Figure 1A) by considering also data for 50 Mediterranean/European populations retrieved from public databases. As expected, centenarians’ ancestry fractions fitted within the range of variation observed for the Italian and other considered populations. The only exception was accounted by the genetic component more represented in Northeastern Europe (light blue), which is slightly increased in centenarians with respect to Italian controls (3.8% vs. 2.3%, p-value = 2*10-5). Previous studies suggested that such a component represents the relic of an ancient genomic background that might be less spread in Southern Europe with respect to northern regions just during the Paleolithic [26]. The contribution of this ancestry fraction to the southern European gene pool was then further reduced by the introduction of additional genetic components throughout migrations from the Middle East after the Last Glacial Maximum (LGM) and during the Epigravettian transition [27,28]. Distribution of this genetic component in the overall Italian population could have been also shaped by post LGM re-expansion of human groups along the peninsula from glacial refugia presumably located in Central/Southern Italy [29]. Interestingly, it is also similarly represented in centenarians and Sardinians (3.8% vs. 3.9%, p-value ns), which are supposed to have escaped Late Neolithic and post-Neolithic genetic reshuffling [30], thus corroborating the hypothesis of a considerably ancient ancestry fraction. Nevertheless, no genes involved in longevity were found to be enriched when considering the 1,894 SNPs informative of this genetic signature.
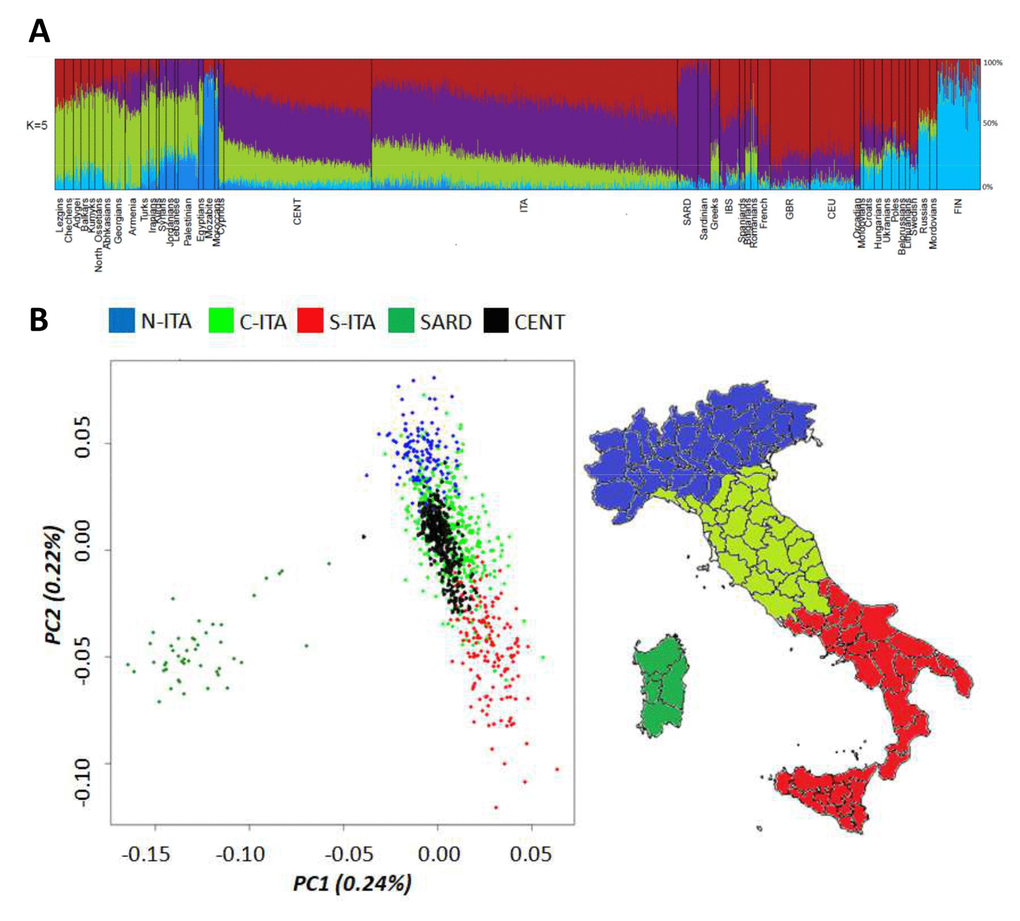
Figure 1. (A) Ancestry proportions at K = 5 estimated by ADMIXTURE analysis performed on Italian centenarians and controls, as well as on 50 Mediterranean and European populations. (B) First and second PCs calculated on the Italian general population (controls). Centenarians were projected as a supplementary group. Individuals from Northern Italy are indicated in blue, from Central Italy in green and from Southern Italy in red. Individuals from Sardinia are displayed in dark green.
To deepen the resolution of our analysis, we restricted the comparison between centenarians and the overall Italian population to a micro-geographical scale. Principal Component Analysis (PCA) showed that centenarians fitted into the previously described patterns of clear differentiation between peninsular Italians and Sardinians described by PC1, as well as of the latitudinal cline of variation pointed out by PC2 [13,31]. However, they seemed to be more homogeneous (i.e. less scattered along PC2) than controls and turned out to overlap mainly with individuals from Central and Southern Italy (Figure 1B), despite their self-reported origins encompassed both Northern, Central and Southern Italian ones. This is suggestive of a peculiar genetic signature mainly represented in Central/Southern Italians and particularly enriched in centenarians, but not directly ascribable to a single ancestry component among those identified by ADMIXTURE analysis.
The observed patterns of differentiation between centenarians and controls were confirmed via a Discriminant Analysis of Principal Components (DAPC) by computing posterior membership probabilities for each individual to belong to the previously described Italian population clusters [13]. Posterior membership probabilities for each centenarian were reported in relation to their place of birth. Concerning centenarians recruited in Northern Italy, only 73% of them was actually born in this geographical area, as expected by migration patterns typical of the recent Italian demographic history. This might represent a first issue partially responsible for the observed close genetic relationship between centenarians and Central/Southern Italians. Nevertheless, also 84% and 10% of the centenarians born in Northern Italy showed appreciable genetic similarity to people respectively from Central and Southern Italy, with only 6% of them being assigned to the Northern Italian cluster. Most of the centenarians recruited in Central Italy were born in such a macro-geographical area (96%), with 42% of them being confirmed to be genetically close to Central Italians and 58% being instead assigned to the Southern Italian group according to the calculated membership probabilities. Finally, all centenarians recruited in Southern Italy are born in the southern regions of the peninsula, but 51% of them were assigned by DAPC to the Central Italian group and 49% to the Southern Italian one.
A possible explanation for such a peculiar pattern is that recent ancestors of most centenarians born in Northern Italy have previously migrated from central/southern regions. Unfortunately, we have no genealogical data for the recruited individuals to formally test this hypothesis. A second explanation is instead that a set of genetic variants sufficiently ancient to be distributed across the entire Italian population, but present at higher frequency in central/southern groups with respect to northern ones, could contribute to increased probability to develop the longevity phenotype and is thus enriched in centenarians irrespectively of their recent micro-geographical origin. Although the proposed hypotheses could not be mutually exclusive, the latter assumption seems to fit better with a maximum parsimony criterion by guessing that an ancestral fraction of the Italian genetic background may act as one of the favourable prerequisites to become centenarian. The peculiar distribution of such a genetic component in the Italian population may stem from its ancient origin and suggests its potential correlation with a series of post-LGM population movements associated to the re-expansion of human groups along the Italian peninsula from central/southern glacial refugia [29]. Subsequent Neolithic migrations that reached Italy [32,33] and, especially, the massive Late Neolithic and Bronze Age demographic processes that reshuffled the genomic landscape mainly of Northern Italians, then plausibly diluted these pre-Neolithic contributions. This had potentially laid the foundation for present-day underrepresentation of such an ancestral component in Northern Italy.
Moreover, population movements from Continental Europe are also supposed to have prompted local adaptations of Northern Italian groups to temperate climate conditions, emphasizing their divergent adaptive trajectory with respect to Central and Southern Italians, which instead received gene flow mainly from Mediterranean populations and were found to be more subjected to pathogen-related selective pressures [13]. To test whether, in addition to the described peculiar demographic history, some of these adaptive events may have shaped traits useful also to reach extreme longevity, we evaluated the association of this phenotype to loci targeted by positive selection in the population groups distributed along the Italian peninsula. For this purpose, we performed a GWAS by comparing centenarians and Italian controls and we searched for the recently identified top candidate adaptive SNPs [13] (46 SNPs, Table 1S) among variants that resulted significantly associated to longevity-.
The quantile-quantile (QQ) plot of association results demonstrated no genomic inflation (λ = 1.02), as showed in Figure 1S-A. As expected according to the complexity of the investigated phenotype, no strong associations were observed at the genome-wide level (Figure 1S-B). However, promising small-effect loci showing nominal significance were identified (p-value < 1*10-4) and reported in Table 2S, including genes already pointed out by the Health and Retirement Study (HRS) (Supplementary description - Part I). Since our cohort of centenarians was made up by 258 females and 75 males, the obtained results revealed genes and SNPs likely involved in female longevity. In fact, we performed the same analysis only on females and it confirmed results obtained by considering all centenarians and the sex as a covariate, while we did not replicate the analysis only on males because of their small sample size (N = 75). Among SNPs significantly associated to longevity (p-value < 1*10-4), six (rs2111720, rs1127102, rs3739704, rs1053959, rs3116602, rs3118914) showed also relevant signatures of positive selection in the Italian population. The most significant one was rs1053959 (exm772339, iHS: S_ITA = 3.67, C_ITA = 3.25, N_ITA = 2.91; p-valuecent-ctrl = 5.97*10-3), which is located on the PTGR1 gene. This variant represents an eQTL and is known to affect PTGR1 expression in different tissues (Table 3S), with the CC genotype being associated to increased gene expression, the CA one to intermediate values and the AA genotype to reduced levels of PTGR1 expression. The C allele, which has been targeted by positive selection in Italians plausibly according to its capability to restrict inflammation and to confer increased resistance to Mycobacterium tuberculosis [13] is more represented in centenarians than in controls. The PTGR1 protein is a prostaglandin reductase 1 and catalyzes the conversion of leukotriene B4, a well-known pro-inflammatory mediator, into its biological less active metabolite. Leukotriene B4 is an arachidonic acid metabolite and was demonstrated to play a central role in inflammatory and metabolic diseases [34]. It is thus included in the arachidonic acid pathway and together with the linoleic acid pathway (described below) pones the regulation of essential fatty acids metabolism as a plausible key mechanism contributing to the development of the longevity phenotype in the Italian population. To our knowledge, this is the first case representative of a past adaptation evolved in response to specific pathogen-related selective pressures that may have favoured the maintenance in a present-day gene pool of variants secondarily involved in longevity.
To identify further gene networks that may underlie the longevity phenotype in Italians, we also conducted pathway analyses by means of i-GSEA4GWAS. Four KEGG pathways (i.e. inositol phosphate metabolism, homologous recombination, linoleic acid metabolism, drug metabolism cytochrome P450) were thus ranked as significantly enriched (FDR ≤ 0.05) in the obtained list of candidate longevity-associated SNPs (for a complete list of significant pathways see Table 4S, all the significant genes in the pathway/gene sets are also reported in Table 5S). Interestingly, a recent paper [35] pointed out similar results when analyzing a different cohort of Italian centenarians, suggesting appreciable genetic influence on the related metabolic profiles. In particular, the authors suggested that Italian centenarians are characterized by a peculiar metabolomic profile that promotes cellular detoxification mechanisms through specific modulation of the arachidonic acid metabolic cascade and through enhanced cytochrome P450 (CYP) enzyme activity. Such an effective mechanism might result in the activation of an anti-oxidative response, as displayed by decreased circulating levels of 9-HODE and 9-oxoODE. These represent reliable markers of lipid peroxidation and oxidative products of linoleic acid, whose altered balance with respect to omega3 is known to be implicated in the side effects of the recently adopted pro-inflammatory diets (more details in Supplementary description - Part II). This is an example of how longevity in the Italian population can be reached by individuals who present genetic backgrounds more apt to face the current environmental and cultural changes. Accordingly, we may speculate that the longevity phenotype and the genes/pathways mainly contributing to it are strictly dependent from the historical period.
Mechanisms of pleiotropy and trade-offs during lifetime
As recently argued, exploring both trade-off-like and conditional effects may considerably improve the understanding of the genetics of human longevity [7]. To this purpose, we exploited the generated data by dividing the Italian controls in two different subgroups according to their age and by analyzing the related allele frequencies trajectories. This approach, which belongs to the so called "gene frequency methods", represents a powerful tool to identify the role of each variant according to the trends showed during aging. In particular, the change of allele frequency with age may follow linear trends (monotonic) or non-monotonic patterns (usually U-shaped patterns or constant trends until a certain age and then linear ones), in which allele frequency decreases at a given age, but then increases, thus reflecting the establishment of trade-offs in the effect of variants at young and old ages. The choice of controls with a wide range of ages (19-85 yrs) has been performed to explicitly test whether the frequency of an allele varies across age, as recently described [35]. Group 1 (i.e. individuals that are less than 50 years old) was considered as representative of the healthy Italian population and of the overall genetic variability observable along the Italian peninsula. Group 2 (i.e. individuals that are more than 50 years old) was instead expected to have been subjected to mortality selection, as recently demonstrated [16]. This means that among all individuals belonging to a similar birth cohort, those who live until a given age threshold do not represent a random sample since subjects with disadvantageous characteristics are more likely to die off. Finally, Group 3 (i.e. individuals older than 100 years of age) could be considered as characterized by a combination of variants (and experienced environment) favorable for human longevity in the context of the overall Italian genomic background.
By following this framework, we identified six categories of variants according to their trajectories of allele frequencies in the three examined groups (Figure 2).
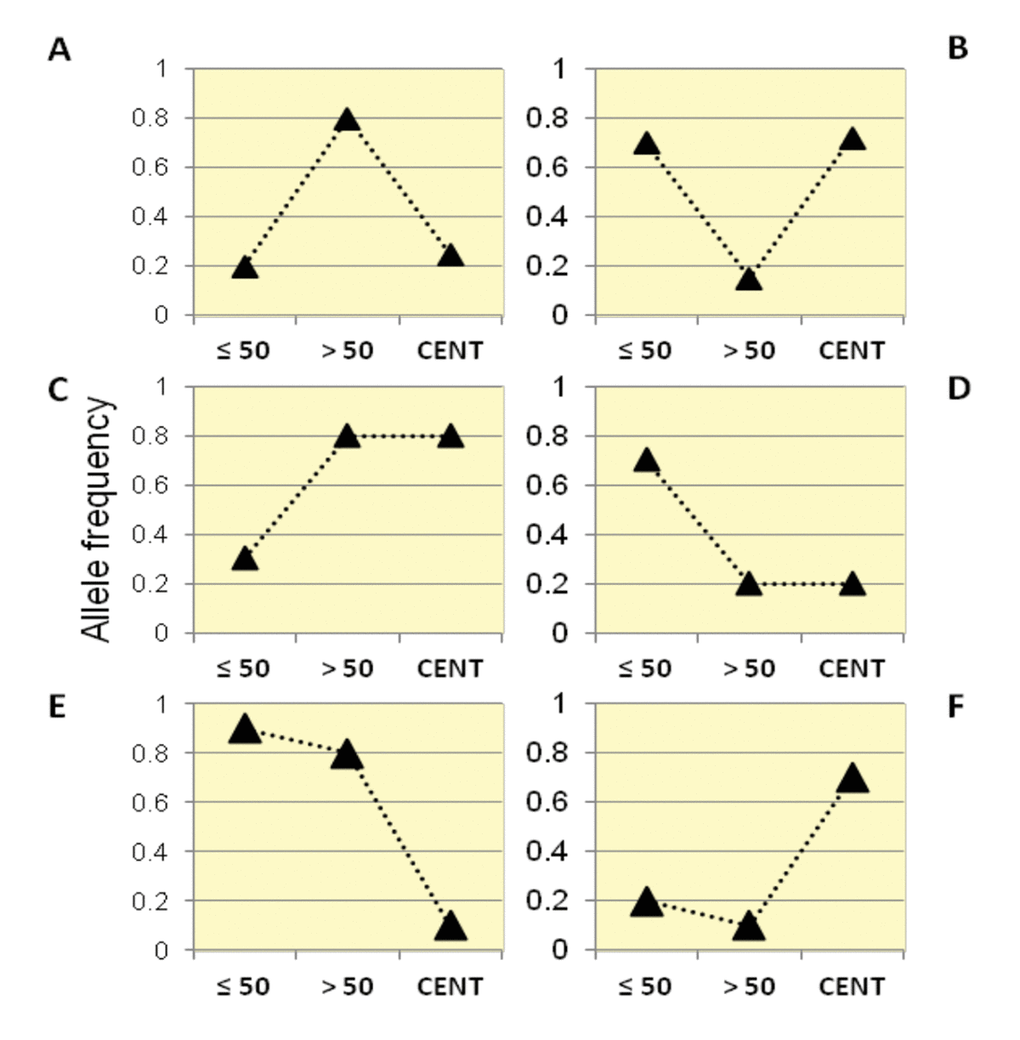
Figure 2. Patterns of allele frequency in the Italian population. SNPs with significant differences in allele frequencies between Group1, Group2 and centenarians (Group 3) were divided into six different categories (Class A, B, C, D, E, F) according to their frequency trajectory over the three examined age intervals.
Class A: SNPs for which Group 2 showed higher allele frequencies than Group 1 and centenarians, while similar allele frequencies were observed in centenarians and Group 1. It is thus supposed that such variants are beneficial in Group 2, but not for longevity (also called "from good to bad").
Class B: SNPs for which Group 2 showed lower allele frequencies than Group 1 and centenarians, while similar allele frequencies in centenarians and Group 1 were observed. It is thus supposed that such variants are beneficial for longevity (also called "from bad to good").
Class C: these variants significantly increased in frequency in Group 2 and in centenarians if compared to the general population (Group 1).
Class D: these variants significantly decreased in frequency in Group 2 and in centenarians if compared to the general population (Group 1).
Class E: these variants significantly decreased in frequency in centenarians, while Group 1 and Group 2 showed similar frequencies.
Class F: these variants significantly increased in frequency in centenarians, while Group 1 and Group 2 showed similar frequencies.
According to the proposed classification, we identified 51 SNPs in Class A, 107 in Class B, 274 in Class C, 329 in Class D, 75 in Class E and 67 in Class F.
In Class A (Table 6S), the four most significant SNPs were mapped in the ESRRG (estrogen related receptor gamma) locus (rs2576234, rs2032028, rs1436897, and rs2576258, with combined p-values 6.72*10-7, 1.36*10-6, 2.02*10-5, and 4.14*10-5, respectively). The rs2576234-C, rs2032028-A, rs1436897-G, and rs2576258-C alleles turned out to be protective against mortality between ages 50 and 85 and then were negatively associated with the probability of becoming centenarian. These candidate SNPs were identified here for the first time and this gene codes for a member of the estrogen receptor-related receptor (ESRR) family. Up-regulation of ESRRG was previously linked to cancer, as well as to enhanced neurite outgrowth, learning and memory. These effects indicate the presence of a trade-off between tumor suppression and brain regeneration influenced by ESRRG. Such a trade-off could contribute to the Class A trajectory of allele frequencies because it may differentially influence survival at the different age intervals. For instance, cancer (all sites) and neurodegenerative disorders, such as Alzheimer's disease, have their peaks of incidence rate at different ages (before and after the age 85, respectively), which means that these disorders may have their biggest impact on the mortality risk at different ages too. If so, genetic variants with a trade-off-like influence on these disorders could be associated with reduced total mortality risk in middle life, due to cancer, and with increased mortality at the oldest-old ages, due to neurodegenerative disorders (see additional examples of these genetic trade-offs in [7,36,37]. Although it is beyond the scope of this study to investigate the effect of differential fertility of different genotypes over time [34], it is interesting to note that ERR (the homologous of human ESRRG in Drosophila), is required to maintain male fertility [35], thus suggesting its potential role in the trade-off reproduction/survival. Some studies showed how some environmental molecules from modern human niche (e.g. bisphenol A, nitrated and chlorinated metabolites) strongly bind to Esrrg receptor [36]. According to this view, future studies are needed to accurately explore the potential trade-off between reproduction and survival (in the light of energy allocation theory) and its role in shaping life history trajectories in modern environments.
When considering Class B (Table 7S), we identified four highly significant SNPs in the EPCAM locus (rs3923559, rs3924917, rs1126497, rs10185866; combined p-values 1.39*10-6, 5.34*10-6, 7.27*10-6, 1.86*10-5, respectively). These SNPs show a differential impact on the expression of two genes, MSH and EPCAM (Table 8S) in different tissues. The former is a protein that recognizes errors in the genome sequence during replication; the latter has instead many functions, such as negative regulation of apoptotic processes and cell-cell adhesion mediated by cadherin, positive regulation of cell motility and cell proliferation, stem cell proliferation and differentiation. The rs3923559-G allele is positively associated to the expression of both EPCAM and MSH genes and is deleterious (we observed a decrease in allele frequencies) between ages 50 and 85. This is probably due to a trade-off between cell proliferation, apoptosis and repair mechanisms in different tissues and then the same allele becomes protective for longevity (i.e. the same allele in a different internal environment and at different ages may have a beneficial effect).
As regards the variants belonging to Class C (Table 9S) and Class D (Table 10S), they seem to have an effect in the middle ages, being instead "neutral" in advanced ages. In Class C, we also identified a SNP (rs17596705) located in COL25A1 a gene identified in the rare variant analysis conducted by Erikson and colleagues [37], who sequenced the whole genomes of individuals >80 years old with no chronic diseases. In particular, such a variant significantly increased in frequency in Group 2 and in Italian centenarians if compared to the general population.
Moreover, we identified multiple significant SNPs at the ATP8B4 gene (eight SNPs in Class C: rs6493392, rs11632984, rs11854435, rs2899446, rs11631945, rs8041864, rs7173644, rs6493393 - combined p-values 8.47*10-7, 5.23*10-6, 6.14*10-6, 6.42*10-6, 1.52*10-5, 7.36*10-5, 3.63*10-4, 4.00*10-4, respectively, and four SNPs in Class D: rs8040030, rs6493402, rs12916154, rs12148767 - combined p-values 3.46*10-7, 4.27*10-5, 1.50*10-4, 5.27*10-4). This locus is involved in phospholipid transport in the cell membrane. We observed high frequency of rs6493392-A, rs11632984-G, rs11854435-G, rs2899446-G, rs11631945-A, rs8041864-G, rs7173644-G, rs6493393-A alleles between ages 50 and 85 and in centenarians indicating a beneficial effect of these alleles after reproductive age. The opposite trend was observed for rs8040030-A, rs6493402-G, rs12916154-G, rs12148767-C alleles after reproductive age. Moreover rs8040030-A, rs6493402-G and rs12148767-C are associated to a reduce expression of ATP8B4 (GTEx) and a significant association between Alzheimer’s disease and the ATP8B4 locus was reported for rs10519262 [38]. Li and colleagues proposed that rs10519262-GG/GA (associated to higher expression level of ATP8B4 according to GTEx) is related to increased probability of Alzheimer’s disease onset by age then rs10519262-AA (associated to lower expression of ATP8B4 according to GTEx). This represents an example of pleiotropy where variants associated to low level of ATP8B4 expression seem deleterious after the reproductive age, but published data support the fact that in the last decades of life individuals with variants associated to low ATP8B4 expression reduced the probability of Alzheimer disease onset.
In Class D (Table 10S), we also identified 11 significant SNPs located in the SORCS2 and SORCS3 genes, which are members of the vacuolar protein sorting 10 (Vps10) family of receptors that play pleiotropic functions in protein trafficking and intracellular/intercellular signaling in both neuronal and non-neuronal cells [38]. This family of receptors has been implicated in diseases of different aetiology and its variants are considered as genetic risk factors for sporadic and autosomal dominant forms of neurodegenerative diseases, including Alzheimer's disease, frontotemporal lobar degeneration, and Parkinson's disease, as well as for type 2 diabetes mellitus and atherosclerosis. The rs4689642-G, rs4689090-A, rs12646898-G, rs16839840-A, rs4689093-G alleles in SORCS2 and the rs17118067-A, rs6584635-A, rs7080542-G, rs10884071-A, rs7073438-A, rs1881224-G alleles in SORCS3 showed a reduced frequency after the age of 50, thus becoming risk alleles in the post reproductive period.
Class E (Table 11S) included significant SNPs in the CLSTN2 and ANO3 genes, which have been already described above as candidate loci pointed out by both association and pathway analyses. This category included also rs157582 (combined p-values = 5.99*10-4), a SNP located in the TOMM40 locus and extensively described to be associated to diastolic blood pressure, high density lipoprotein cholesterol measurement, high levels of triglycerides (A allele) and Alzheimer diseases [39–41]. The rs157582-A allele was found to be beneficial (or neutral) until 85 years, while its frequency decreases in centenarians indicating a potential deleterious impact for reaching longevity.
Finally, Class F (Table 12S) included significant variants at genes described above, such as SMARCA2, IRAK2, and NACAD, as well as two SNPs (rs16578 and rs6505393 combined p-values 5.84*10-6 and 3.19*10-4, respectively) that mapped on the ASIC2 locus. This gene seems to play a role in neurotransmission and it has been described as a plausible candidate locus in a meta-analysis of four GWASs of survival to age 90 years or older [42] and in a recent paper focused on Chinese centenarians [43].
Overall, the analysis of SNPs allele frequency per age class identified promising candidate loci for further studies. In particular, more data and biological validation on longitudinal cohorts of centenarians are needed to better clarify the role of these genes in shaping complex gene-environment (GxE) interactions.