The association between clinical characteristics and prognosis
The association between clinical characteristics and NSCLC patient survival (OS and PFS) are shown in Table 1. We found that age was not associated with PFS (P=0.643) or OS (P=0.660). Although gender was not associated with PFS, men had slightly worse OS compared to women (HR=1.27, 95% CI: 1.00-1.60, P=0.048). Smoking was associated with PFS and OS. Notably, smokers had worse PFS (HR=2.48, 95% CI: 1.79-3.42, P<0.001) and OS (HR=1.55, 95% CI: 1.21-1.98, P<0.001) than non-smokers. The TNM (Tumor Node Metastasis) stage was also associated with NSCLC prognosis. Patients with stage IIIB disease had a shorter duration of PFS (HR=2.17, 95% CI:1.59-2.95, P<0.001) and OS (HR=1.72, 95% CI:1.35-2.21, P<0.001) than patients with stage IIIA disease. Furthermore, patients receiving a radiation dose of <70 Gy had a poorer PFS (HR=1.74, 95% CI:1.31-2.32, P<0.001) and OS (HR=1.31, 95% CI:1.04-1.66, P=0.022) than patients receiving a dose of ≥70 Gy. Drinking (P=0.595 for PFS, P=0.992 for OS), KPS (P=0.873 for PFS, P=0.249 for OS), histological type (P=0.5780 for PFS, P=0.227 for OS), and chemotherapy (P=0.132 for PFS, P=0.074 for OS) did not affect patient survival.
Table 1. Association between clinical characteristics and progression-free survival and overall survival in patients with NSCLC.
| Parameters | Category | Progression-free survival | Overall survival |
| MST | Event/Total | HR (95%CI) | Pa | MST | Event/Total | HR (95%CI) | Pa |
| Age | <60 | 58.5 | 70/193 | 1.00 | | 46.3 | 105/193 | 1.00 | |
| ≥60 | 53.3 | 122/319 | 1.07(0.80-1.44) | 0.643 | 48.2 | 179/319 | 1.06(0.83-1.34) | 0.660 |
| Sex | Female | 56.2 | 90/233 | 1.00 | | 49.9 | 122/233 | 1.00 | |
| Male | 54.2 | 102/279 | 1.01(0.76-1.34) | 0.957 | 44.7 | 162/319 | 1.27(1.00-1.60) | 0.048 |
| Body mass index | <24 | 54.4 | 127/324 | 1.00 | | 45.2 | 181/324 | 1.00 | |
| ≥24 | 54.6 | 65/188 | 0.85(0.63-1.15) | 0.289 | 49.7 | 103/188 | 0.93(0.73-1.19) | 0.930 |
| Smoking | No | 70.0 | 49/219 | 1.00 | | 56.3 | 95/219 | 1.00 | |
| Yes | 43.7 | 143/293 | 2.48(1.79-3.42) | <0.001 | 40.9 | 189/293 | 1.55(1.21-1.98) | 0.001 |
| Drinking | No | 55.6 | 95/262 | 1.00 | | 47.7 | 143/262 | 1.00 | |
| Yes | 54.9 | 97/250 | 1.08(0.81-1.43) | 0.595 | 46.3 | 141/250 | 0.99(0.79-1.25) | 0.992 |
| KPS | ≥80 | 55.8 | 95/249 | 1.00 | | 47.9 | 130/249 | 1.00 | |
| <80 | 54.6 | 97/263 | 1.02(0.77-1.36) | 0.873 | 46.2 | 154/263 | 1.15(0.91-1.45) | 0.249 |
| Histology | SCC | 54.8 | 73/192 | 1.00 | | 44.1 | 114/192 | 1.00 | |
| ADC and other | 55.0 | 119/320 | 0.96(0.72-1.28) | 0.780 | 47.8 | 170/320 | 0.86(0.68-1.10) | 0.227 |
| TNM stage | IIIA | 64.1 | 58/227 | 1.00 | | 58.7 | 93/227 | 1.00 | |
| IIIB | 48.3 | 134/285 | 2.17(1.59-2.95) | <0.001 | 39.9 | 191/285 | 1.72(1.35-2.21) | <0.001 |
| Chemotherapy | No | 57.8 | 108/305 | 1.00 | | 48.0 | 161/305 | 1.00 | |
| Yes | 48.6 | 84/207 | 1.25(0.94-1.66) | 0.132 | 44.9 | 123/207 | 1.24(0.98-1.57) | 0.074 |
| Radiation technique | IMRT | 53.0 | 99/263 | 1.00 | | 47.9 | 145/263 | 1.00 | |
| CRT and other | 55.1 | 93/249 | 0.96(0.73-1.28) | 0.799 | 46.2 | 139/249 | 0.95(0.75-1.19) | 0.634 |
| Dose | ≥70Gy | 63.2 | 80/269 | 1.00 | | 49.6 | 134/269 | 1.00 | |
| <70Gy | 44.3 | 112/243 | 1.74(1.31-2.32) | <0.001 | 44.1 | 150/243 | 1.31(1.04-1.66) | 0.022 |
| Pa: P value for univariate cox regression; MST: mean survival time; KPS: Karnofsky Performance Status; SCC, squamous cell carcinoma; ADC, adenocarcinoma; IMRT, Intensity Modulated Radiation Therapy; CRT, three-dimensional conformal radiotherapy. |
The association between HIF1A gene polymorphisms and survival of NSCLC patients receiving radiation therapy
The association between HIF1A gene polymorphisms and NSCLC patient survival (PFS and OS) were assessed using Kaplan-Meier analysis and multivariate Cox regression analysis (Table 2). Of the four SNPs (rs11549465, rs11549467, rs2057482, and rs10873142), two (rs11549467 and rs10873142) were not associated with patient survival. Interestingly, rs11549465 was associated with NSCLC prognosis. Patients with CT (median survival time [MST]: 56.2 months) and TT (MST: 27.4 months) genotypes had a shorter duration of PFS (P<0.001, Figure 1A) and OS (MST: 47.7 for CC, 52.1 for CT, 29.3 for TT, P<0.001) compared to patients with CC genotypes (MST: 60.8, Figure 1B). After adjusting for potential confounding factors, multivariate cox regression indicated that TT genotype was associated with poorer PFS (HR=2.07, 95% CI: 1.42-3.01, P<0.001) and OS (HR=1.63, 95% CI: 1.18-2.24, P=0.003). Patients with CT or TT polymorphisms had shorter median PFS compared to those with CC polymorphisms (47.7 vs. 60.8, P=0.003, Figure 1C). The median OS was similar between patients with CT+TT and CC polymorphisms (44.8 vs. 47.7, P=0.077, Figure 1D). Patients with CT+TT alleles had a lower PFS (HR=1.39, 95% CI: 1.03-1.86, P=0.029) than those with a CC genotype, although the OS was similar between the 2 groups (HR=1.16, 95% CI: 0.91-1.47, P=0.239). Patients with the TT genotype had a poorer PFS (MST: 27.4 vs. 59.7, P<0.001, Figure 1E) and OS (MST: 29.3 vs. 51.4, P<0.001, Figure 1F) compared to those with the CC+CT genotype. The TT genotype was associated with an increased risk of adverse outcomes (PFS: HR=2.01, 95% CI: 1.14-2.85, P<0.001; OS: HR=1.66, 95% CI: 1.22-2.24, P=0.001). For rs11549467, there were no significant differences in PFS (GG vs. GA vs. AA: 52.7 vs. 58.4 vs. 51.7, P=0.111, Figure 2A) or OS (GG vs. GA vs. AA: 45.0 vs. 44.6 vs. 55.4, P=0.633, Figure 2B) compared with the other three genotypes. Moreover, we found no differences in PFS (P=0.076, Figure 2C) or OS (P=0.478, Figure 2D) between the GA+AA and GG groups. Multivariate Cox regression analyses confirmed similar results for AA vs. GG+GA (PFS: P=0.728, Figure 2E; OS: P=0.385, Figure 2F).
Table 2. Associations of HIF1-alpha gene with PFS and OS in patients with NSCLC.
| SNP | Progression-free survival | Overall survival |
| Event/No. | MST | Pa* | Adjusted HR (95%CI) | Pb* | Event/No. | MST | Pa* | Adjusted HR (95%CI) | Pb* |
| rs11549465 | | | | | | | | | | |
| CC | 96/298 | 60.8 | | 1.00 | | 151/298 | 47.7 | | 1.00 | |
| CT | 52/146 | 56.2 | | 1.09(0.77-1.54) | 0.621 | 76/146 | 52.1 | | 0.95(0.72-1.26) | 0.726 |
| TT | 44/68 | 27.4 | <0.001 | 2.07(1.42-3.01) | <0.001 | 57/68 | 29.3 | <0.001 | 1.63(1.18-2.24) | 0.003 |
| Trend# | | | | | | | | | | |
| CC | 96/298 | 60.8 | | 1.00 | | 151/298 | 47.7 | | 1.00 | |
| CT+TT | 96/214 | 47.7 | 0.003 | 1.39(1.03-1.86) | 0.029 | 133/214 | 44.8 | 0.077 | 1.16(0.91-1.47) | 0.239 |
| CC+CT | 148/444 | 59.7 | | 1.00 | | 227/444 | 51.4 | | 1.00 | |
| TT | 44/68 | 27.4 | <0.001 | 2.01(1.41-2.85) | <0.001 | 57/68 | 29.3 | <0.001 | 1.66(1.22-2.24) | 0.001 |
| rs11549467 | | | | | | | | | | |
| GG | 124/311 | 52.7 | | 1.00 | | 171/311 | 45.0 | | 1.00 | |
| GA | 48/152 | 58.4 | | 0.76(0.54-1.06) | 0.110 | 89/152 | 44.6 | | 1.02(0.79-1.33) | 0.856 |
| AA | 20/49 | 51.7 | 0.111 | 1.15(0.71-1.87) | 0.565 | 24/49 | 55.4 | 0.633 | 0.92(0.59-)1.42 | 0.697 |
| Trend# | | | | | | | | | | |
| GG | 124/311 | 52.7 | | 1.00 | | 171/311 | 45.0 | | 1.00 | |
| GA+AA | 68/201 | 56.6 | 0.076 | 0.84(0.62-1.14) | 0.264 | 113/201 | 49.8 | 0.478 | 1.00(0.78-1.28) | 0.999 |
| GG+GA | 172/463 | 55.8 | | 1.00 | | 260/463 | 45.3 | | 1.00 | |
| AA | 20/49 | 51.7 | 0.728 | 1.26(0.78-2.02) | 0.340 | 24/49 | 55.4 | 0.385 | 0.91(0.59-1.39) | 0.909 |
| rs2057482 | | | | | | | | | | |
| CC | 100/314 | 61.3 | | 1.00 | | 161/314 | 48.4 | | 1.00 | |
| CT | 68/161 | 48.9 | | 1.32(0.97-1.81) | 0.078 | 90/161 | 49.3 | | 1.03(0.79-1.33) | 0.855 |
| TT | 24/37 | 19.8 | <0.001 | 2.05(1.30-3.23) | 0.002 | 33/37 | 28.5 | 0.002 | 1.71(1.16-2.51) | 0.007 |
| Trend# | | | | | | | | | | |
| CC | 100/314 | 61.3 | | 1.000 | | 161/314 | 48.4 | | 1.00 | |
| CT+TT | 92/198 | 44.7 | 0.005 | 1.46(1.09-1.94) | 0.010 | 123/198 | 44.2 | 0.254 | 1.14(0.90-1.45) | 0.270 |
| CC+CT | 168/475 | 58.0 | | 1.00 | | 251/475 | 50.4 | | 1.00 | |
| TT | 24/37 | 19.8 | <0.001 | 1.84(1.19-2.86) | 0.007 | 33/37 | 28.5 | <0.001 | 1.69(1.16-2.46) | 0.006 |
| rs10873142 | | | | | | | | | | |
| TT | 119/288 | 52.0 | | 1.00 | | 177/288 | 44.6 | | 1.00 | |
| TC | 61/172 | 57.5 | | 0.80(0.59-1.10) | 0.167 | 83/172 | 49.5 | | 0.82(0.63-1.06) | 0.130 |
| CC | 12/52 | 57.1 | 0.076 | 0.53(0.29-)0.96 | 0.037 | 24/52 | 51.8 | 0.081 | 0.68(0.44-1.04) | 0.078 |
| Trend# | | | | | | | | | | |
| TT | 119/288 | 52.0 | | 1.00 | | 177/288 | 44.6 | | 1.00 | |
| TC+CC | 73/224 | 59.7 | 0.080 | 0.74(0.55-1.02) | 0.054 | 107/224 | 50.9 | 0.038 | 0.78(0.61-1.00) | 0.045 |
| TT+TC | 180/460 | 54.5 | | 1.00 | | 260/460 | 47.1 | | 1.00 | |
| CC | 12/52 | 57.1 | 0.044 | 0.57(0.31-1.03) | 0.063 | 24/52 | 51.8 | 0.102 | 0.73(0.45-1.11) | 0.139 |
| *Pa, Log-rank P; Pb, multivariate Cox regression; MST, mean survival time. |
| #Trend: the prognosis showed an increased or decreased changed with the number of risk allele. |
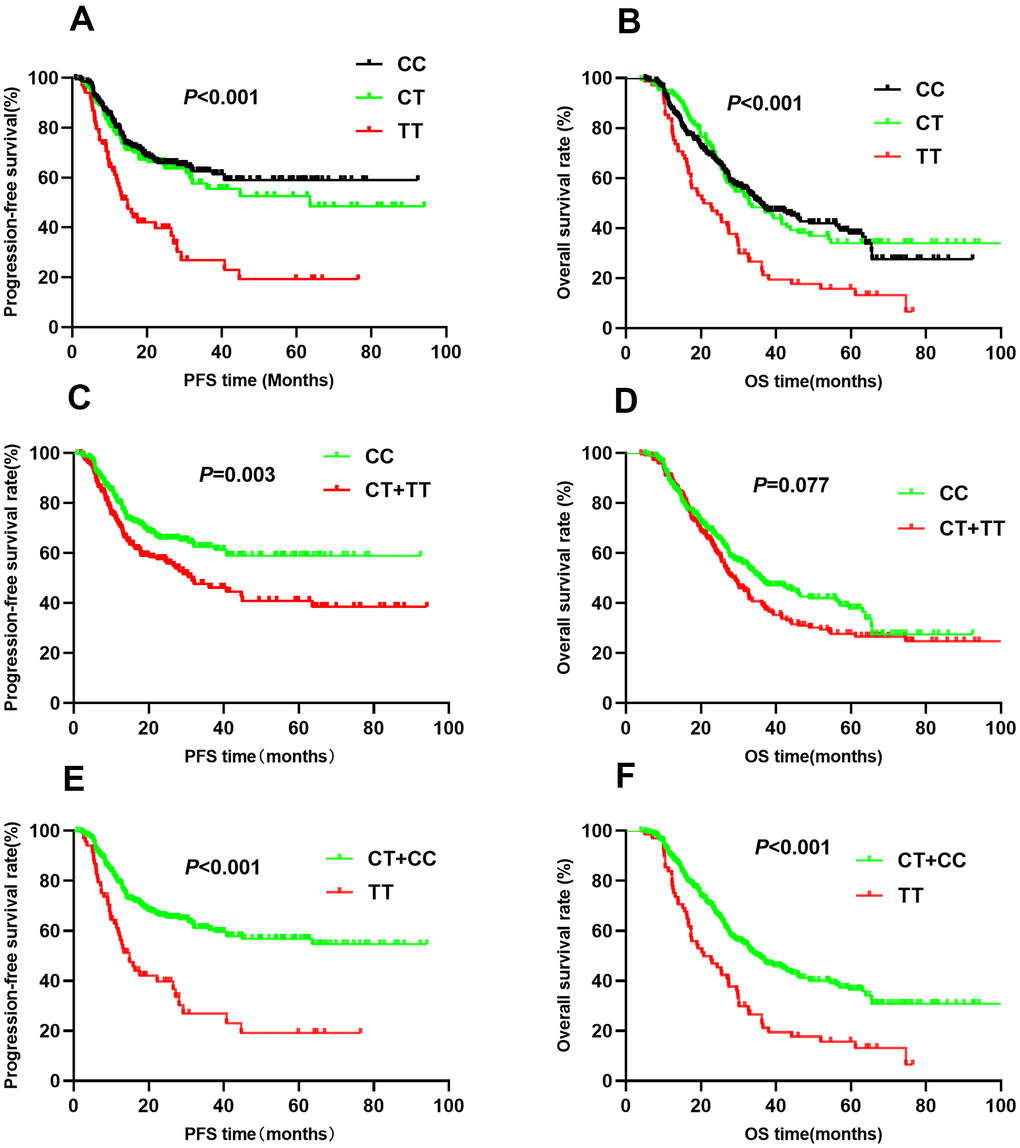
Figure 1. Kaplan-Meier survival curve analysis showing progression-free survival ((A) CC vs CT vs TT, (C) CT+TT vs CC, (E) TT vs CT+CC) and overall survival ((B) CC vs CT vs TT, (D) CT+TT vs CC, (F) TT vs CT+CC) of NSCLC patients with HIF1-alpha rs11549465.
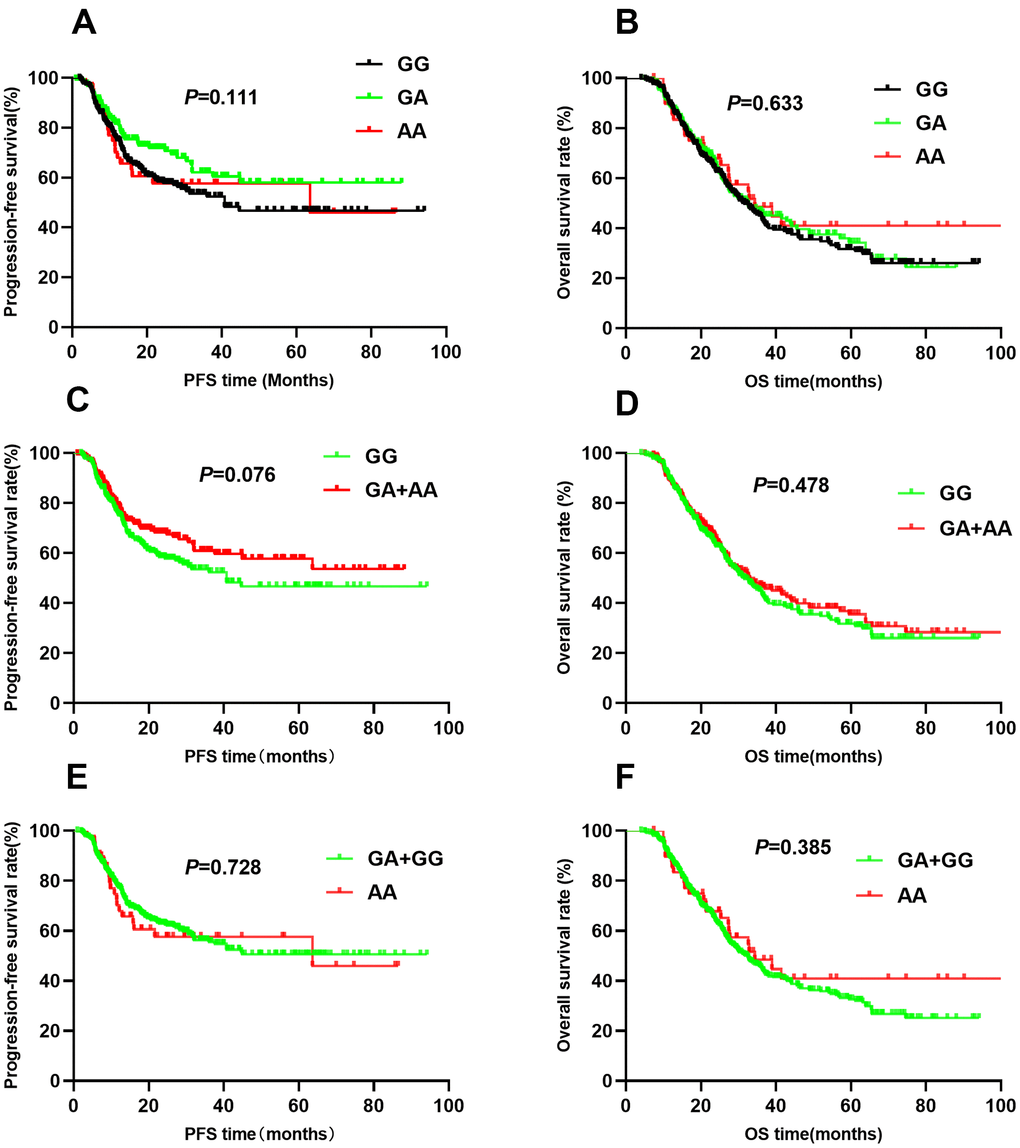
Figure 2. Kaplan-Meier survival curve analysis showing progression-free survival ((A) GG vs GA vs AA, (C) GA+AA vs GG, (E) AA vs GA+GG) and overall survival (B) GG vs GA vs AA, (D) GA+AA vs GG, (F) AA vs GA+GG) of NSCLC patients with HIF1-alpha rs11549467.
The rs2057482 SNP was associated with poor NSCLC patient survival. Compared to patients with CC genotypes, those with CT and TT genotypes had a shorter median PFS (CC vs. CT vs. TT: 61.3 vs. 48.9 vs. 19.8, P<0.001, Figure 3A) and OS (CC vs. CT vs. TT: 48.4 vs. 49.3 vs. 28.5, P<0.001, Figure 3B). Multivariate Cox regression analyses indicated that the TT genotype was associated with a poor PFS (HR=2.05, 95% CI: 1.30-3.23, P=0.002) and OS (HR=1.71, 95% CI: 1.16-2.51, P=0.007). Trend analysis indicated that the domain effect model (CT+TT) was associated with a shorter median PFS (44.7 vs. 61.3, P=0.005, Figure 3C), whereas the median OS was similar between the CT+TT and CC groups (44.2 vs. 48.4, P=0.254, Figure 3D). Patients with CT+TT genotypes had worse PFS (HR=1.46, 95% CI: 1.09-1.94, P=0.010) than those with the CC genotype; However, the OS was similar (HR=1.14, 95% CI: 0.90-1.45, P=0.70). Kaplan-Meier analysis indicated that patients with the TT genotype had worse PFS (MST: 19.8 vs. 58.0, P<0.001, Figure 3E) and OS (MST: 28.5 vs. 50.4, P<0.001, Figure 3F) than those with the CC+CT genotypes. Cox regression analyses confirmed that the TT genotype increased the risk of adverse outcomes (PFS: HR=1.84, 95% CI: 1.19-2.86, P=0.007; OS: HR=1.69, 95% CI: 1.16-2.46, P=0.006).
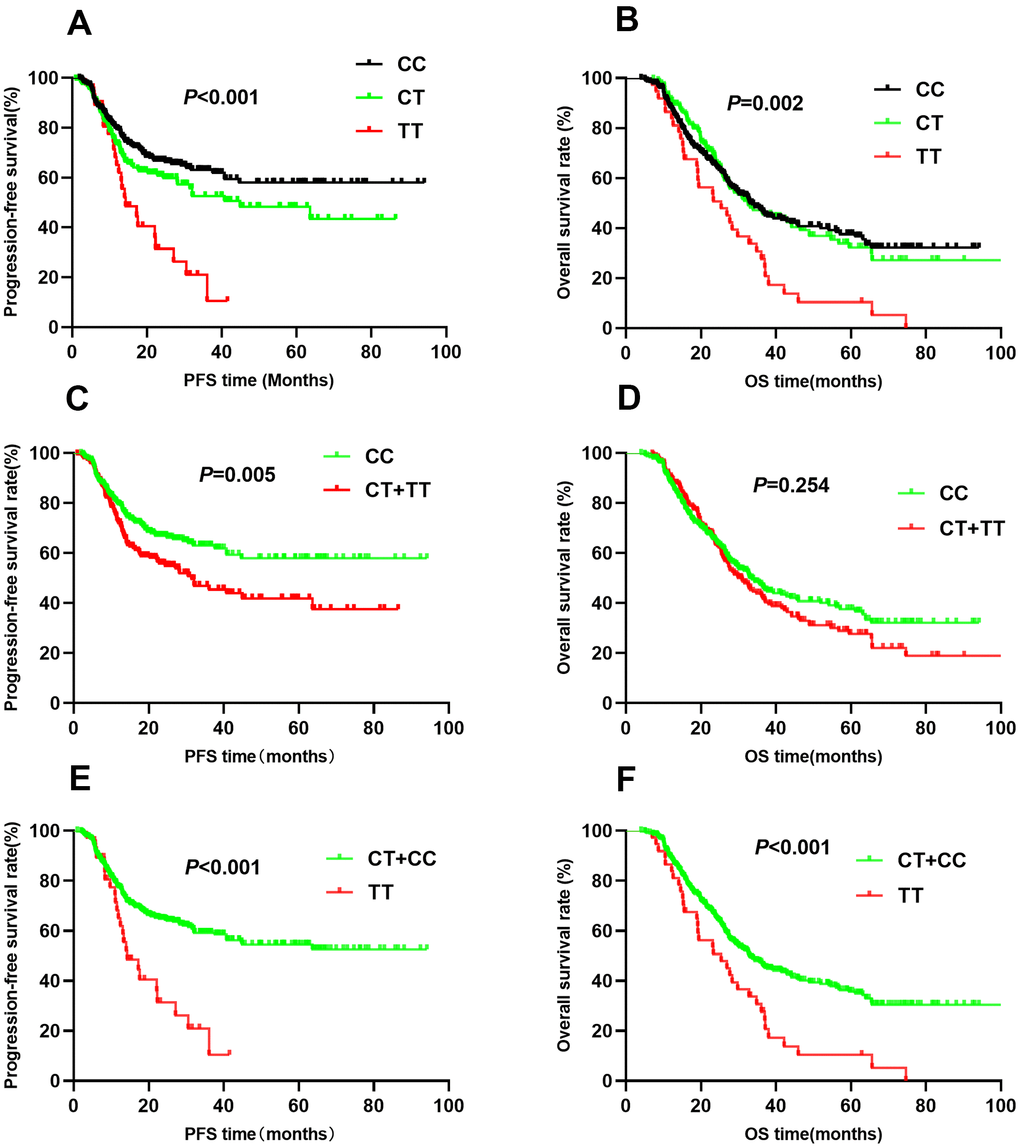
Figure 3. Kaplan-Meier survival curve analysis showing progression-free survival ((A) CC vs CT vs TT, (C) CT+TT vs CC, (E) TT vs CT+CC) and overall survival ((B) CC vs CT vs TT, (D) CT+TT vs CC, (F) TT vs CT+CC) of NSCLC patients with HIF1-alpha rs2057482.
For rs10873142, no differences were observed in PFS (TT vs. TC vs. CC: 52.0 vs. 57.5 vs. 57.1, P=0.076, Figure 4A) or OS (TT vs. TC vs. CC: 44.6 vs. 59.5 vs. 51.8, P=0.081, Figure 4B) among the different genotypes. Patients with TC+CC genotypes had a similar PFS as those with the TT genotype (P=0.080, Figure 4C). Trend analysis indicated a weak association between the TC+CC genotypes and OS (P=0.038, Figure 4D). Additionally, the CC genotype was associated with PFS (P=0.044, Figure 4E) but not OS (P=0.102, Figure 4F). Multivariate Cox regression analyses showed that genotypes were associated with PFS. However, the TC+CC genotype was weakly associated with OS (HR=0.78, 95% CI: 0.61-1.00, P=0.045). To correct for multiple comparisons, we calculated the false-positive probability with a prior probability of 0.01 to detect an HR of 1.2 or 0.83. These results are presented in Table 3. The associations of all four SNPs remained significant with a prior FPRP of 0.1.
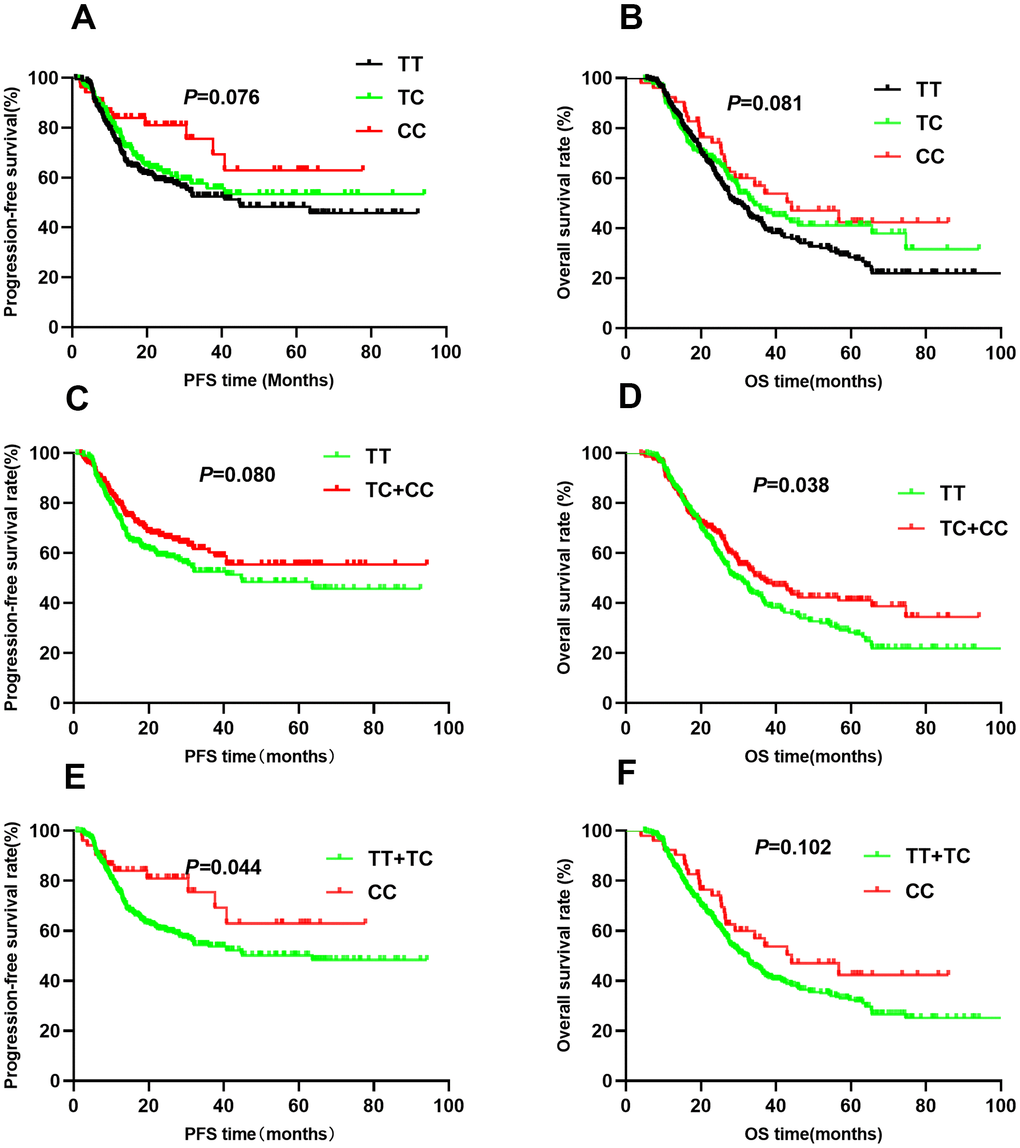
Figure 4. Kaplan-Meier survival curve analysis showing progression-free survival ((A) CC vs CT vs TT, (C) CT+TT vs CC, (E) TT vs CT+CC) and overall survival ((B) CC vs CT vs TT, (D) CT+TT vs CC, (F) TT vs CT+CC) of NSCLC patients with HIF1-alpha rs10873142.
Table 3. False-positive reports probability values for associations between gene and survival outcomes.
| SNP | Progression-free survival | Overall survival |
| HR (95%CI) | Pa | Prior probability | HR (95%CI) | Pa | Prior probability |
| | | 0.2 | 0.1 | 0.01 | | | 0.2 | 0.1 | 0.01 |
| rs11549465 | | | | | | | | | | |
| CT vs. CC | 1.09(0.77-1.54) | 0.621 | 0.090 | 0.182 | 0.710 | 0.95(0.72-1.26) | 0.726 | 0.041 | 0.087 | 0.513 |
| TT vs. CC | 2.07(1.42-3.01) | <0.001 | 0.118 | 0.231 | 0.768 | 1.63(1.18-2.24) | 0.003 | 0.066 | 0.137 | 0.636 |
| CT/TT vs.CC | 1.39(1.03-1.86) | 0.029 | 0.046 | 0.099 | 0.547 | 1.16(0.91-1.47) | 0.239 | 0.018 | 0.040 | 0.313 |
| rs11549467 | | | | | | | | | | |
| GA vs.GG | 0.76(0.54-1.06) | 0.110 | 0.078 | 0.161 | 0.678 | 1.02(0.79-1.33) | 0.856 | 0.031 | 0.067 | 0.442 |
| AA vs.GG | 1.15(0.71-1.87) | 0.565 | 0.241 | 0.416 | 0.887 | 0.92(0.59-)1.42 | 0.697 | 0.182 | 0.334 | 0.846 |
| GA/AA vs.GG | 0.84(0.62-1.14) | 0.264 | 0.056 | 0.119 | 0.597 | 1.00(0.78-1.28) | 0.999 | 0.022 | 0.048 | 0.359 |
| rs2057482 | | | | | | | | | | |
| CT vs. CC | 1.32(0.97-1.81) | 0.078 | 0.064 | 0.134 | 0.630 | 1.03(0.79-1.33) | 0.855 | 0.026 | 0.057 | 0.399 |
| TT vs. CC | 2.05(1.30-3.23) | 0.002 | 0.205 | 0.368 | 0.865 | 1.71(1.16-2.51) | 0.007 | 0.128 | 0.248 | 0.784 |
| CT/GTT vs. CC | 1.46(1.09-1.94) | 0.010 | 0.042 | 0.090 | 0.520 | 1.14(0.90-1.45) | 0.270 | 0.02 | 0.043 | 0.330 |
| rs10873142 | | | | | | | | | | |
| TC vs. TT | 0.80(0.59-1.10) | 0.167 | 0.066 | 0.138 | 0.638 | 0.82(0.63-1.06) | 0.130 | 0.024 | 0.053 | 0.379 |
| CC vs. TT | 0.53(0.29-)0.96 | 0.037 | 0.061 | 0.128 | 0.617 | 0.68(0.44-1.04) | 0.078 | 0.162 | 0.303 | 0.827 |
| TC/CC vs. TT | 0.74(0.55-0.99) | 0.044 | 0.042 | 0.090 | 0.522 | 0.78(0.61-1.00) | 0.045 | 0.021 | 0.045 | 0.342 |
| Pa, P value for multivariate Cox regression. |
Stratified analysis of HIF1A genotype effects on NSCLC prognosis
To explore the relationship between clinical characteristics, HIF1A polymorphisms (rs11549465 and rs2057482), and survival outcomes, we conducted stratified analyses (Tables 4, 5). Among smokers, patients with the rs11549465 TT genotype had a worse PFS than patients with the CC genotype (20.4 vs. 42.1, P=0.004). Multivariate Cox regression analyses confirmed the association of the TT genotype with PFS (HR=1.91, 95% CI: 1.23-2.95, P=0.004) and OS (HR=1.84, 95% CI: 1.25-2.70, P=0.002). Among non-smokers, the TT genotype was associated with PFS (39.9 vs. 74.9; HR=2.31, 95% CI: 1.08-4.97, P=0.032) but not OS (adjusted P=0.3737). The association between rs11549465 polymorphisms and PFS was not affected by the histological type (P<0.05). Although TT was not associated with OS (P=0.165) in SCC patients, it was associated with OS in patients with ADC or other lung cancer types (P=0.002). The TT genotype was associated with poor prognosis (PFS and OS) in patients with stage IIIA disease and those treated with chemotherapy, but not associated with OS in patients with stage IIIB disease (P=0.063) or those receiving chemotherapy (P=0.318). The radiation dose also influenced the association between rs11549465 polymorphisms and NSCLC prognosis. Among patients receiving a dose of ≥70 Gy, the TT genotype increased the risk of poor PFS (P<0.001) and OS (P=0.006). For patients receiving a dose of <70 Gy, the TT genotype was associated with PFS (HR=1.83, 95% CI: 1.09-3.04, P=0.021) but not OS (HR=1.47, 95% CI: 0.92-2.35, P=0.107).
Table 4. Stratified analysis of clinical parameters for rs11549465 and survival outcomes.
| Parameters | Subgroup | Genotype | Progression-free survival | Overall survival |
| Event/No. | MST | Pa | HR*(95%CI) | Pb | Event/No. | MST | Pa | HR*(95%CI) | Pb |
| rs11549465 | | | | | | | | | | | | |
| Smoking | Yes | CC | 72/165 | 42.1 | | 1.00 | | 99/165 | 40.7 | | 1.00 | |
| | CT | 37/81 | 47.0 | 0.311 | 0.94(0.62-1.42) | 0.775 | 48/81 | 46.3 | 0.618 | 0.84(0.58-1.21) | 0.343 |
| | TT | 34/47 | 20.4 | 0.004 | 1.91(1.23-2.95) | 0.004 | 42/47 | 24.5 | 0.068 | 1.84(1.25-2.70) | 0.002 |
| | CT+TT | 71/128 | 38.6 | 0.046 | 1.24(0.88-1.75) | 0.226 | 90/128 | 38.6 | 0.215 | 1.13(0.83-1.53) | 0.442 |
| No | CC | 24/133 | 74.9 | | 1.00 | | 52/133 | 56.3 | | 1.00 | |
| | CT | 15/65 | 66.3 | 0.900 | 1.41(0.73-)2.73 | 0.310 | 28/65 | 56.6 | 0.463 | 1.05(0.65-1.68) | 0.852 |
| | TT | 10/21 | 39.9 | <0.001 | 2.31(1.08-4.97) | 0.032 | 15/21 | 38.6 | <0.001 | 1.31(0.72-2.38) | 0.373 |
| | CT+TT | 25/86 | 60.2 | 0.046 | 1.67(0.94-2.97) | 0.082 | 43/86 | 51.8 | 0.247 | 1.13(0.74-1.71) | 0.582 |
| Histology | SCC | CC | 28/100 | 57.3 | | 1.00 | | 51/100 | 43.1 | | 1.00 | |
| | CT | 23/61 | 51.7 | 0.206 | 1.47(0.83-2.61) | 0.191 | 38/61 | 44.7 | 0.489 | 1.18(0.76-1.83) | 0.453 |
| | TT | 22/31 | 24.0 | <0.001 | 2.41(1.30-4.48) | 0.006 | 25/31 | 31.1 | 0.030 | 1.43(0.86-2.37) | 0.165 |
| | CT+TT | 45/92 | 43.4 | 0.005 | 1.79(1.09-2.94) | 0.023 | 63/92 | 41.0 | 0.130 | 1.27(0.86-1.86) | 0.228 |
| ADC and other | CC | 68/198 | 58.1 | | 1.00 | | 100/198 | 49.1 | | 1.00 | |
| | CT | 29/85 | 54.9 | 0.952 | 0.93(0.59-1.46) | 0.754 | 38/85 | 53.8 | 0.321 | 0.80(0.54-1.18) | 0.252 |
| | TT | 22/37 | 28.4 | 0.001 | 2.08(1.27-3.42) | 0.004 | 32/37 | 27.6 | <0.001 | 1.96(1.29-2.97) | 0.002 |
| | CT+TT | 51/122 | 47.6 | 0.120 | 1.24(0.85-1.80) | 0.272 | 70/122 | 45.2 | 0.357 | 1.10(0.80-1.51) | 0.222 |
| Stage | IIIA | CC | 28/143 | 71.7 | | 1.00 | | 52/143 | 57.2 | | 1.00 | |
| | CT | 21/65 | 51.7 | 0.066 | 1.79(1.00-3.20) | 0.051 | 27/65 | 60.2 | 0.851 | 1.09(0.67-1.75) | 0.734 |
| | TT | 9/19 | 37.7 | 0.002 | 3.76(1.65-8.57) | 0.002 | 14/19 | 31.4 | 0.001 | 2.95(1.53-5.70) | 0.001 |
| | CT+TT | 30/84 | 51.7 | 0.009 | 2.08(1.21-3.55) | 0.008 | 41/84 | 54.3 | 0.171 | 1.35(0.88-2.07) | 0.172 |
| IIIB | CC | 68/155 | 44.6 | | 1.00 | | 99/155 | 38.8 | | 1.00 | |
| | CT | 31/81 | 55.8 | 0.586 | 0.82(0.53-1.27) | 0.368 | 49/81 | 43.9 | 0.583 | 0.89(0.62-1.27) | 0.507 |
| | TT | 35/49 | 22.6 | 0.001 | 1.73(1.14-2.65) | 0.011 | 43/49 | 29.0 | 0.023 | 1.42(0.98-2.05) | 0.063 |
| | CT+TT | 66/130 | 43.6 | 0.182 | 1.14(0.80-1.63) | 0.455 | 92/130 | 38.2 | 0.447 | 1.08(0.81-1.46) | 0.593 |
| Chemotherapy | No | CC | 54/187 | 63.4 | | 1.00 | | 90/187 | 50.5 | | 1.00 | |
| | CT | 29/79 | 56.9 | 0.137 | 1.55(0.98-2.46) | 0.063 | 38/79 | 52.4 | 0.994 | 1.06(0.72-)1.57 | 0.767 |
| | TT | 25/39 | 23.7 | <0.001 | 2.94(1.78-4.87) | <0.001 | 33/39 | 27.9 | <0.001 | 2.07(1.35-3.17) | 0.001 |
| | CT+TT | 54/118 | 47.7 | 0.001 | 1.97(1.34-2.91) | 0.001 | 71/118 | 43.5 | 0.047 | 1.37(0.99-1.88) | 0.057 |
| Yes | CC | 42/111 | 48.1 | | 1.00 | | 61/111 | 39.8 | | 1.00 | |
| | CT | 23/67 | 51.9 | 0.479 | 0.72(0.42-1.22) | 0.223 | 38/67 | 48.1 | 0.530 | 0.79(0.51-1.20) | 0.264 |
| | TT | 19/29 | 30.0 | 0.038 | 1.22(0.69-2.17) | 0.492 | 24/29 | 30.8 | 0.132 | 1.29(0.79-2.11) | 0. 318 |
| | CT+TT | 42/96 | 44.9 | 0.670 | 0.88(0.56-1.39) | 0.591 | 62/96 | 43.7 | 0.858 | 0.93(0.64-1.34) | 0.684 |
| Dose | ≥70Gy | CC | 34/150 | 69.7 | | 1.00 | | 65/150 | 53.0 | | 1.00 | |
| | CT | 26/85 | 63.0 | 0.136 | 1.36(0.80-2.32) | 0.252 | 39/85 | 53.1 | 0.954 | 0.94(0.62-1.42) | 0.938 |
| | TT | 20/34 | 24.8 | <0.001 | 3.01(1.67-5.41) | <0.001 | 30/34 | 28.8 | <0.001 | 1.91(1.20-3.01) | 0.006 |
| | CT+TT | 46/119 | 53.7 | 0.002 | 1.77(1.11-2.83) | 0.016 | 69/119 | 44.8 | 0.088 | 1.19(0.84-1.71) | 0.331 |
| <70Gy | CC | 62/148 | 42.5 | | 1.00 | | 86/148 | 39.2 | | 1.00 | |
| | CT | 26/61 | 44.5 | 0.995 | 0.98(0.61-1.58) | 0.983 | 37/61 | 46.8 | 0.906 | 0.99(0.66-1.47) | 0.944 |
| | TT | 24/34 | 26.9 | 0.003 | 1.83(1.09-3.04) | 0.021 | 27/34 | 29.6 | 0.030 | 1.47(0.92-2.35) | 0.107 |
| | CT+TT | 50/95 | 39.0 | 0.141 | 1.25(0.85-1.84) | 0.265 | 64/95 | 42.3 | 0.323 | 1.14(0.81-1.60) | 0.461 |
| *Pa, Log-rank P; Pb, cox regression; SCC, squamous cell carcinoma; ADC, adenocarcinoma; MST, mean survival time. |
Table 5. Stratified analysis of clinical parameters for rs2057482 and survival outcomes.
| Parameters | Subgroup | Genotype | Progression-free survival | Overall survival |
| Event/No. | MST | Pa | HR*(95%CI) | Pb | Event/No. | MST | Pa | HR*(95%CI) | Pb |
| rs2057482 | | | | | | | | | | | | |
| Smoking | Yes | CC | 75/178 | 48.9 | | 1.00 | | 107/178 | 43.4 | | 1.00 | |
| | CT | 53/93 | 36.6 | 0.062 | 1.31(0.91-1.87) | 0.147 | 61/93 | 39.2 | 0.916 | 1.00(0.72-1.38) | 0.998 |
| | TT | 15/22 | 20.1 | 0.023 | 1.48(0.84-2.62) | 0.173 | 21/22 | 26.6 | 0.027 | 1.55(0.96-2.52) | 0.075 |
| | CT+TT | 68/115 | 35.0 | 0.018 | 1.34(0.96-1.88) | 0.087 | 82/118 | 36.6 | 0.390 | 1.10(0.82-1.48) | 0.541 |
| No | CC | 25/136 | 75.0 | | 1.00 | | 54/136 | 43.4 | | 1.00 | |
| | CT | 15/68 | 65.2 | 0.710 | 1.31(0.67-2.54) | 0.434 | 29/68 | 39.2 | 0.900 | 1.08(0.67-1.73) | 0.763 |
| | TT | 9/15 | 19.0 | <0.001 | 4.65(1.99-10.89) | <0.001 | 12/15 | 26.6 | 0.009 | 2.40(1.22-4.73) | 0.012 |
| | CT+TT | 24/83 | 57.9 | 0.131 | 1.77(0.98-3.18) | 0.058 | 41/83 | 52.9 | 0.455 | 1.29(0.84-1.97) | 0.247 |
| Histology | SCC | CC | 29/111 | 68.2 | | 1.00 | | 59/111 | 46.7 | | 1.00 | |
| | CT | 32/64 | 36.3 | 0.002 | 2.43(1.43-4.13) | 0.001 | 39/64 | 43.5 | 0.390 | 1.31(0.86-1.99) | 0.206 |
| | TT | 12/17 | 14.9 | <0.001 | 4.09(1.99-8.43) | <0.001 | 16/17 | 23.1 | <0.001 | 2.71(1.49-4.93) | 0.001 |
| | CT+TT | 44/81 | 33.1 | <0.001 | 2.71(1.65-4.46) | <0.001 | 55/81 | 38.4 | 0.059 | 1.53(1.04-2.24) | 0.032 |
| ADC and other | CC | 71/203 | 56.3 | | 1.00 | | 102/203 | 48.9 | | 1.00 | |
| | CT | 36/97 | 54.5 | 0.875 | 0.90(0.60-1.36) | 0.624 | 51/97 | 19.2 | 0.534 | 0.89(0.63-1.25) | 0.505 |
| | TT | 12/20 | 22.7 | 0.045 | 1.47(0.78-2.76) | 0.237 | 17/20 | 33.4 | 0.100 | 1.29(0.76-2.19) | 0.354 |
| | CT+TT | 48/117 | 50.4 | 0.633 | 1.00(0.69-1.45) | 0.992 | 68/117 | 45.6 | 0.990 | 0.97(0.71-1.32) | 0.822 |
| Stage | IIIA | CC | 28/132 | 68.1 | | 1.00 | | 47/132 | 58.6 | | 1.00 | |
| | CT | 21/79 | 54.2 | 0.492 | 1.19(0.67-2.11) | 0.561 | 32/79 | 59.4 | 0.974 | 0.93(0.59-1.47) | 0.757 |
| | TT | 9/16 | 21.6 | <0.001 | 4.45(1.93-10.22) | <0.001 | 14/16 | 27.0 | <0.001 | 2.56(1.34-4.88) | 0.004 |
| | CT+TT | 30/95 | 50.1 | 0.094 | 1.52(0.90-2.58) | 0.118 | 46/95 | 53.2 | 0.251 | 1.15(0.76-1.75) | 0.512 |
| IIIB | CC | 72/182 | 55.6 | | 1.00 | | 114/182 | 42.2 | | 1.00 | |
| | CT | 47/82 | 37.9 | 0.033 | 1.34(0.92-1.96) | 0.131 | 58/82 | 38.9 | 0.559 | 1.07(0.77-1.48) | 0.688 |
| | TT | 15/21 | 18.6 | 0.028 | 1.56(0.88-2.75) | 0.127 | 19/21 | 29.7 | 0.170 | 1.35(0.82-2.23) | 0.239 |
| | CT+TT | 62/103 | 35.2 | 0.009 | 1.39(0.98-1.97) | 0.065 | 77/103 | 36.5 | 0.317 | 1.13(0.84-1.52) | 0.430 |
| Chemotherapy | No | CC | 62/194 | 60.6 | | 1.00 | | 97/194 | 49.1 | | 1.00 | |
| | CT | 38/95 | 51.4 | 0.363 | 1.22(0.81-1.84) | 0.350 | 49/95 | 49.9 | 0.593 | 1.00(0.70-1.42) | 0.997 |
| | TT | 8/16 | 18.9 | 0.032 | 1.70(0.80-3.62) | 0.170 | 15/16 | 25.8 | 0.001 | 2.28(1.31-3.98) | 0.004 |
| | CT+TT | 46/111 | 49.6 | 0.165 | 1.28(0.87-1.89) | 0.214 | 64/111 | 45.6 | 0.684 | 1.16(0.84-1.60) | 0.380 |
| Yes | CC | 38/120 | 57.0 | | 1.00 | | 64/120 | 46.7 | | 1.00 | |
| | CT | 30/66 | 43.6 | 0.105 | 1.37(0.83-2.25) | 0.217 | 41/66 | 42.2 | 0.580 | 1.05(0.70-1.58) | 0.804 |
| | TT | 16/21 | 19.4 | 0.001 | 2.41(1.31-4.42) | 0.005 | 18/21 | 30.7 | 0.126 | 1.43(0.83-2.48) | 0.197 |
| | CT+TT | 46/87 | 37.2 | 0.011 | 1.62(1.04-2.53) | 0.032 | 59/87 | 38.6 | 0.269 | 1.14(0.79-1.65) | 0.480 |
| Dose | ≥70Gy | CC | 42/169 | 67.3 | | 1.00 | | 72/169 | 54.6 | | 1.00 | |
| | CT | 30/86 | 56.5 | 0.106 | 1.53(0.95-2.48) | 0.080 | 49/86 | 45.2 | 0.142 | 1.51(1.04-)2.19 | 0.029 |
| | TT | 8/14 | 21.4 | 0.003 | 2.70(1.22-5.98) | 0.014 | 13/14 | 29.1 | 0.001 | 2.61(1.42-4.93) | 0.002 |
| | CT+TT | 38/100 | 52.6 | 0.026 | 1.68(1.07-2.63) | 0.025 | 62/100 | 41.4 | 0.025 | 1.65(1.17-)2.34 | 0.004 |
| <70Gy | CC | 58/145 | 50.1 | | 1.00 | | 89/145 | 39.6 | | 1.00 | |
| | CT | 38/75 | 41.1 | 0.448 | 1.17(0.77-1.78) | 0.467 | 41/75 | 50.9 | 0.119 | 0.69(0.47-1.01) | 0.059 |
| | TT | 16/23 | 18.4 | 0.016 | 1.75(0.99-3.10) | 0.054 | 20/23 | 27.5 | 0.153 | 1.38(0.83-2.30) | 0.215 |
| | CT+TT | 54/98 | 37.2 | 0.131 | 1.30(0.89-1.90) | 0.169 | 61/98 | 45.4 | 0.443 | 0.83(0.59-1.16) | 0.273 |
| *Pa, Log-rank P; Pb, multivariate Cox regression; SCC, squamous cell carcinoma; ADC, adenocarcinoma; MST, mean survival time; MST, mean survival time. |
Smoking did not influence the association between rs2057482 polymorphisms and survival outcomes (PFS and OS). The TT genotype was associated with PFS and OS in both smokers and non-smokers. In SCC patients, the TT genotype was associated with a poor PFS (HR=1.09, 95% CI:1.99-8.43, P<0.001) and OS (HR=2.71, 95% CI:1.49-4.93, P=0.001). These associations were not significant in patients with other histological types. The disease stage also affected the association between rs2057482 polymorphisms and prognosis. For instance, patients with stage IIIA disease had the TT genotype associated with PFS (P<0.001) and OS (P=0.004); These associations were not significant in patients with stage IIIB disease. Patients that did not receive chemotherapy had a poorer OS (HR=2.28, 95% CI: 1.31-3.98, P=0.004) compared to those receiving chemotherapy. In contrast, patients receiving chemotherapy had a worse PFS (HR=2.41, 95% CI: 1.31-4.42, P=0.005). For patients receiving a dose of ≥70 Gy, the TT genotype was associated with a poor PFS (HR=2.70, 95% CI: 1.22-5.98, P=0.014) and OS (HR=2.61, 95% CI: 1.42-4.93, P=0.002). For patients receiving a dose of<70Gy, t However, none of genotypes were associated with survival.