Causal effect of sepsis on LTL (causal pathway 1)
In forward analysis, the potential genetic tools that met the threshold conditions were 15 SNPs, which were confirmed to be related to sepsis. These quasi-genetic tools were used to reconcile LTL-related independent loci, then 16 SNPs were screened. After excluding a duplicate SNP (rs7103228), 15 independent SNPs were considered as powerful genetic tools in the study. See Supplementary Table 2 for details of specific summary data.
As shown in Figure 2A, we do not observe a significant causal relationship between sepsis and LTL under the IVW model: β (SE) is −0.0051 (0.0075) with a p-value of 0.499. What’s more, the results of the three models, MR Egger, Weighted median and weighted mode, are consistent with those of IVW (Table 1). It is worth noting that 95% CI became closer near zero, which increased the credibility of non-causality discovery.
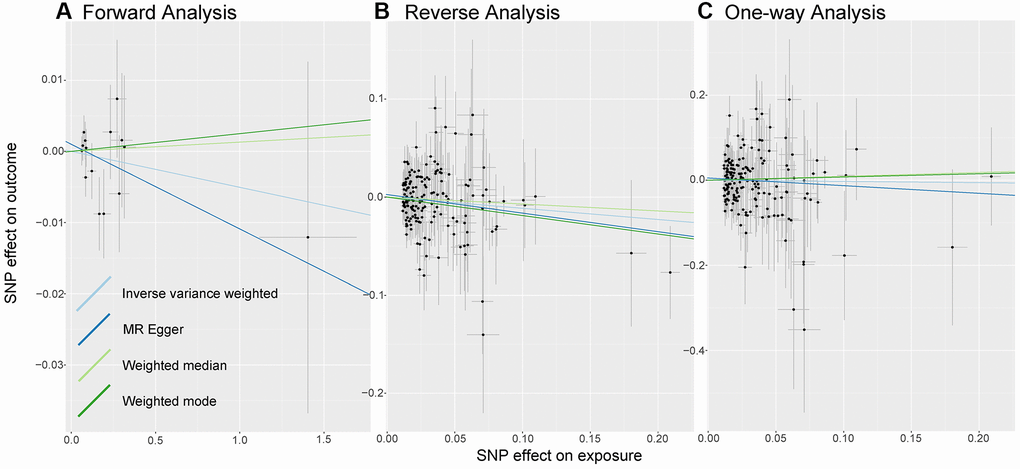
Figure 2. Analysis of MR. There are scatter plots of the association between exposure SNP effect and outcome one. Analysis is conducted using the conventional inverse-variance-weighted MR method and complementary methods, including MR-Egger, weighted median, weighted mode approaches. Causal judgment depends on slope after each linear fitting. (A) Used to determine the causal effect of sepsis on LTL. (B) Utilized to determine the causal effect of LTL on sepsis. (C) Designed to judge the causal effect of LTL on 28-day mortality. Abbreviations: LTL: Leukocyte Telomere Length; MR: Mendelian randomization; SNP: single-nucleotide polymorphism.
Table 1. Results of mendelian randomization analysis.
| Exposure | Outcome | Methods | OR (95% CI) | Β (SE) | P value |
| Forward Analysis |
| Sepsis | LTL | IVW | – | −0.0051 (0.0075) | 0.499 |
| MR Egger | – | −0.0119 (0.0127) | 0.366 |
| Weighted median | – | 0.0013 (0.0104) | 0.901 |
| Weighted mode | – | 0.0025 (0.0149) | 0.870 |
| Reverse Analysis |
| LTL | Sepsis | IVW | 0.89 (0.80–0.99) | −0.1143 (0.0566) | 0.043 |
| MR Egger | 0.83 (0.68–1.01) | −0.1894 (0.1001) | 0.060 |
| Weighted median | 0.93 (0.78–1.11) | −0.0706 (0.0881) | 0.423 |
| Weighted mode | 0.83 (0.69–1.00) | −0.1885 (0.0956) | 0.050 |
| One-way Analysis |
| LTL | Septic 28-day death | IVW | 0.97 (0.76–1.24) | −0.0287 (0.1261) | 0.820 |
| MR Egger | 0.84 (0.54–1.29) | −0.1801 (0.2231) | 0.421 |
| Weighted median | 1.10 (0.73–1.65) | 0.0912 (0.2088) | 0.662 |
| Weighted mode | 1.08 (0.67–1.73) | 0.0760 (0.2415) | 0.753 |
| Abbreviations: CI: confidence interval; IVW: inverse variance weighted; LTL: leukocyte telomere length; MR: Mendelian randomization; OR: odds ratio; SE: standard error. |
Causal effect of LTL on sepsis (causal pathway 2)
We selected genetic instrumental variables for reverse analysis from 211 independent loci associated with LTL. 39 of those SNPs were missing in the GWAS of sepsis. Also, we removed being palindromic with intermediate allele frequencies: rs2306646, rs56178008, and rs73154592. Therefore, we finally included 169 polymorphic variants as genetic tools in the reverse MR analysis (Supplementary Table 3).
In the causal inference analysis, we find that shorter LTL would increase susceptibility to sepsis (Figure 2B). As shown in Table 1, based on the IVW model, the OR (95% CI) is 0.89 (0.80–0.99) and the p-value is 0.043. Additionally, although in the MR-Egger, Weighted median model and Weighted Mode model the association is not statistically significant (all p-value are more than 0.05), the values of β (SE) are −0.1894 (0.1001), −0.0706 (0.0881), and −0.1885 (0.0956). What’s more, the directions of other models remain consistent with IVW. The results we observe support the idea that there is a causal relationship between LTL and sepsis.
Causal effect of LTL on 28-day mortality (causal pathway 3)
Genetic instrumental variables included in reverse analysis and one-way analysis were identical. 184 SNPs were utilized as instrumental variables for telomere length to participate in one-way MR analysis. See Supplementary Table 3 for details.
As shown in Figure 2C, there is no evidence of a causal trend between genetically determined LTL and 28-day death. As shown in Table 1, after linear data fitting by IVW, MR-Egger, Weighted Median and Weighted Mode, β (SE) is −0.0287 (0.1261), −0.1801 (0.2231), 0.0912 (0.2088), and 0.0760 (0.2415), respectively. 95% confidence intervals for OR are wide, with p-values greater than 0.05, then associations are not shown to be significant in different models.
Exploration of pleiotropy and heterogeneity
As shown in Figure 3, the distribution of SNPs as genetic tools is symmetrical on both sides of the IVW line and MR Egger line, no matter in bidirectional MR analysis or one-way analysis.
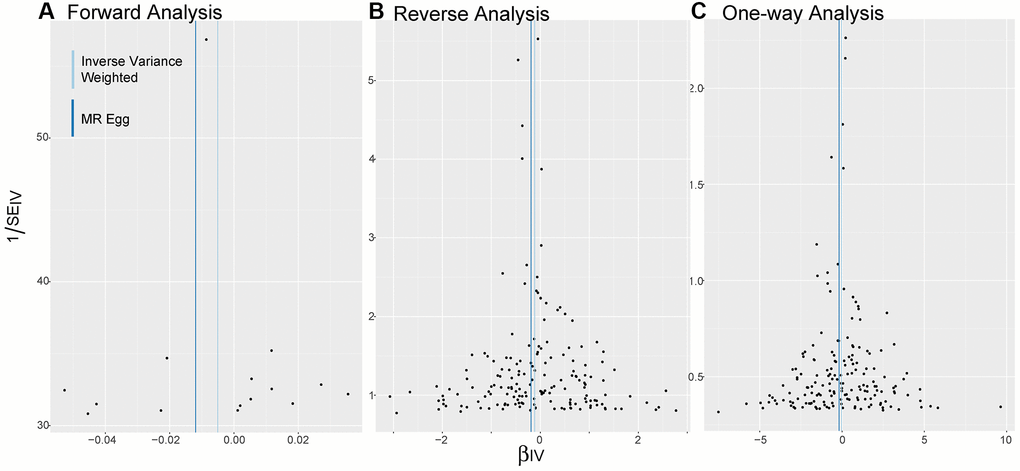
Figure 3. Funnel plots. (A–C) Are applied to detect whether the observed associations of different analyses were along with obvious heterogeneity. Distribution of SNPs as genetic tools is symmetrical on both sides of the IVW line and MR Egger line. Abbreviations: IV: instrumental variables; IVW: inverse variance weighted; SE: standard error.
Results of the leave-one-out method can be seen in Figure 4. In Figure 4A, 4C, no single SNP drives these results, and correlations do not change significantly, which confirms the stability of results in both forward analysis and one-way analysis. Surprisingly, in Figure 4B, there exist 20 SNPs: rs1291143, rs35640778, rs7705526, rs9419958, rs1985369, rs34003787, rs9878436, rs2282764, rs78701368, rs28502153, rs75664430, rs79755767, rs9923119, rs77426195, rs7218033, rs34762068, rs2069536, s2555104, rs4498805 and rs11866592. Elimination of these have a dramatic impact on the overall result: correlation shifts significantly. Results of the Single SNP analysis of MR can be seen in Figure 5. The vast majority of SNPs estimate crossed a value of 0, indicating that the results were not significant. However, it is noteworthy that there are 12 SNPs evaluated in the reverse analysis with significantly different results. The marked red SNPs (rs34003787, rs7555872, rs9878436, rs2282764, rs9923119, rs78701368, rs1985369 and rs7705526) support the result of MR analysis; the marked blue those (rs12572897, rs17843641, rs201125976 and rs2977608) reject it. Based on the results of leave out method and single SNP analysis, we obtain seven SNPs (overlap): rs7705526, rs1985369, rs34003787, rs9878436, rs2282764, rs78701368, rs9923119. The genomic loci variants mapped by these SNPs may have an unusual role in the mechanism of increased susceptibility to sepsis by short LTL.
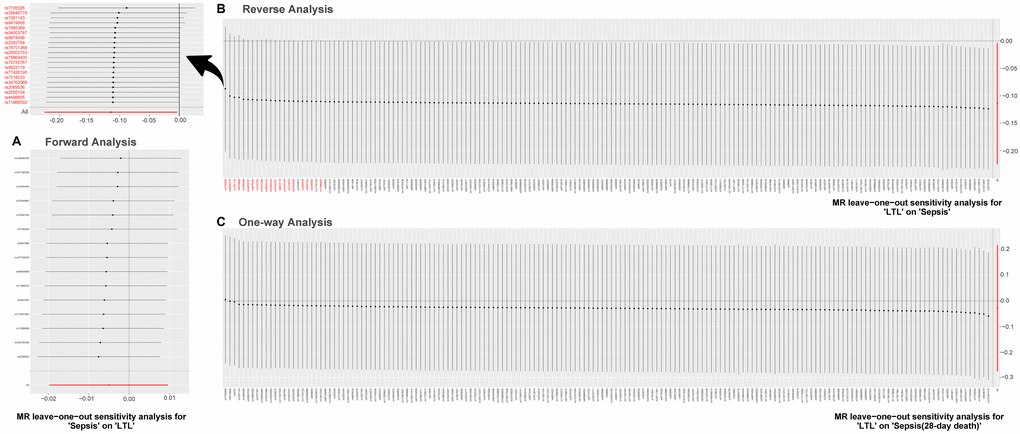
Figure 4. MR leave-one-out sensitivity analysis. Leave-one-out analysis is used to evaluate whether any SNP is driving the causal effect. (A) Represents the results of MR leave−one−out sensitivity analysis for “Sepsis” on “LTL”. (B) Reflects the findings of MR leave−one−out sensitivity analysis for “LTL” on “Sepsis”, which change dramatically when SNPs marked in red are removed. (C) Contains the results of MR leave−one−out sensitivity analysis for “LTL” on “Sepsis (28-day death)”. Abbreviations: LTL: leukocyte telomere length; MR: Mendelian randomization; SNPs: single-nucleotide polymorphisms.
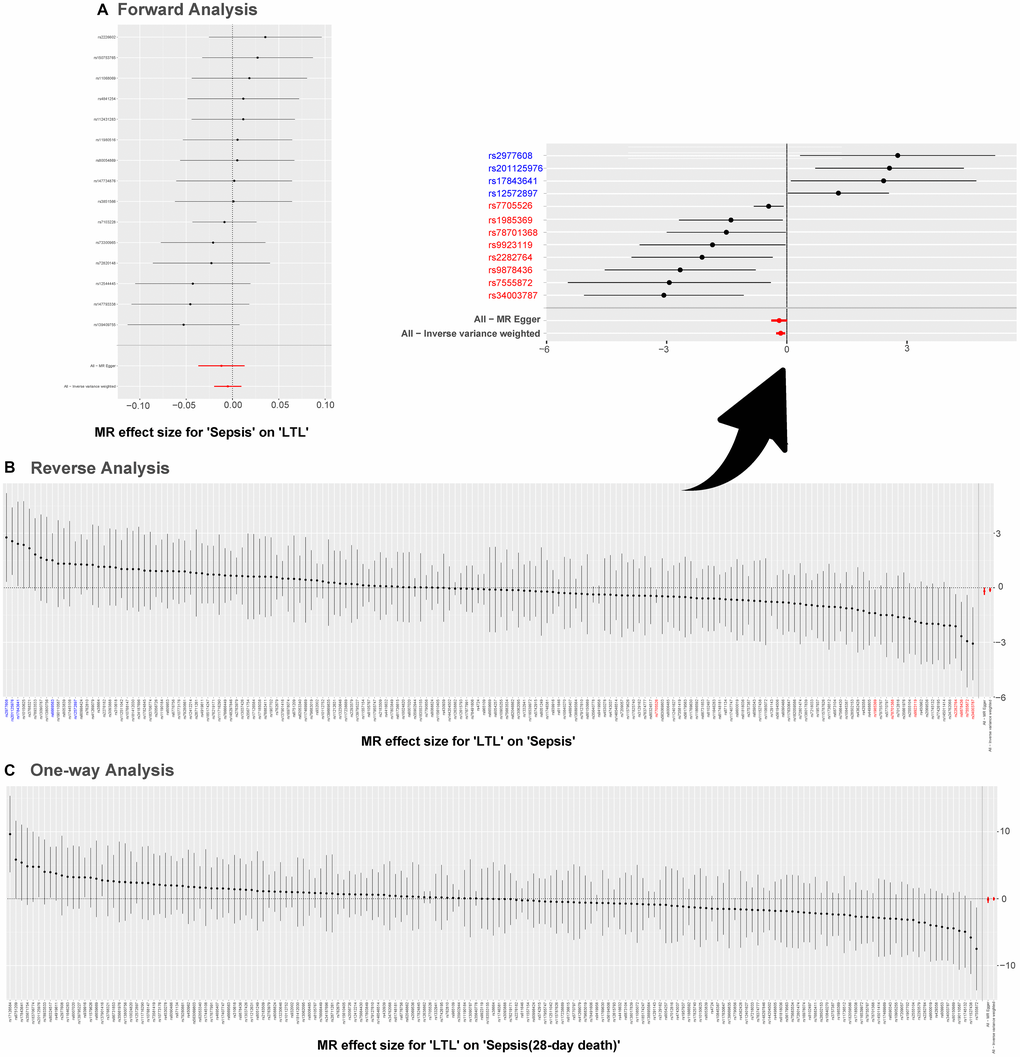
Figure 5. Single SNP analysis of MR. (A–C) are used to show the MR estimate and 95% CI values for each SNP, also show the IVW and MR-Egger MR results at the bottom. In (B), SNP marked in red supports the result that short LTL increases the susceptibility to sepsis; the blue marked SNP rejects the MR result. Abbreviations: LTL: leukocyte telomere length; MR: Mendelian randomization; SNPs: single-nucleotide polymorphisms.
MR Egger intercept test is used to evaluate directional pleiotropy. The confidence interval of the intercept contains 0, and the P values are greater than 0.05 (Table 2), indicating that there is no potential incidence of directional pleiotropy. On the other hand, MR-PRESSO judgment of horizontal pleiotropy is equal to and diverged from the former: p values of Global Test for forward analysis and one-way analysis are 0.828 and 0.223 respectively; however, in reverse analysis, P value is 0.027, which suggests that the analysis may be influenced by serious outliers.
Table 2. Pleiotropy and heterogeneity analysis.
| Design | MR-Egger regression | MR PRESSO_global test | Heterogeneity analysis |
| Intercept (SE) | P val | P val | Method | Q | Q_P val |
| Forward Analysis | 0.0010 (0.0015) | 0.516 | 0.828 | IVW | 10.32 | 0.738 |
| MR-Egger | 9.878 | 0.704 |
| Reverse Analysis | 0.0026 (0.0028) | 0.365 | 0.027 | IVW | 202.6 | 0.035 |
| MR-Egger | 201.6 | 0.035 |
| One-way Analysis | 0.0052 (0.0063) | 0.412 | 0.223 | IVW | 168.5 | 0.474 |
| MR-Egger | 167.8 | 0.467 |
| Abbreviations: IVW: inverse variance weighted; MR: Mendelian randomization; MR PRESSO: Mendelian randomization pleiotropy residual sum and outlier; P val: p value; SE: standard error. |
Test of heterogeneity often relies on modified Cochran Q statistic. As shown in Table 2, there is no significant heterogeneity between forward analysis and one-way analysis (P > 0.05 for IVW model and P > 0.05 for MR-Egger model). One issue is recognized in Reverse Analysis: overall heterogeneity is large. However, the heterogeneity is acceptable in this study using IVW with random effects as the primary outcome.