Investigating causal associations among gut microbiota, gut microbiota-derived metabolites, and gestational diabetes mellitus: a bidirectional Mendelian randomization study
Abstract
Background: Previous studies have shown that gut microbiota (GM) and gut microbiota-derived metabolites are associated with gestational diabetes mellitus (GDM). However, the causal associations need to be treated with caution due to confounding factors and reverse causation.
Methods: This study obtained genetic variants from genome-wide association study including GM (N = 18,340), GM-derived metabolites (N = 7,824), and GDM (5,687 cases and 117,89 controls). To examine the causal association, several methods were utilized, including inverse variance weighted, maximum likelihood, weighted median, MR-Egger, and MR.RAPS. Additionally, reverse Mendelian Randomization (MR) analysis and multivariable MR were conducted to confirm the causal direction and account for potential confounders, respectively. Furthermore, sensitivity analyses were performed to identify any potential heterogeneity and horizontal pleiotropy.
Results: Greater abundance of Collinsella was detected to increase the risk of GDM. Our study also found suggestive associations among Coprobacter, Olsenella, Lachnoclostridium, Prevotella9, Ruminococcus2, Oscillibacte, and Methanobrevibacter with GDM. Besides, eight GM-derived metabolites were found to be causally associated with GDM. For the phenylalanine metabolism pathway, phenylacetic acid was found to be related to the risk of GDM.
Conclusions: The study first used the MR approach to explore the causal associations among GM, GM-derived metabolites, and GDM. Our findings may contribute to the prevention and treatment strategies for GDM by targeting GM and metabolites, and offer novel insights into the underlying mechanism of the disease.
Introduction
Gestational diabetes mellitus (GDM) is a dangerous gestational complication affecting 5-20% of pregnant women, and its prevalence is on the rise [1]. GDM increases the probability of adverse pregnancy outcomes, such as preterm birth, fetal malformation, and macrosomia [2–4]. It is also associated with maternal health problems, including gestational hypertension, postpartum hemorrhage, and dystocia in mothers [2, 5]. Additionally, offspring of mothers with GDM face an elevated risk of diabetes, hypertension, obesity, and coronary heart disease [3, 6]. Although various mechanisms including β-cell dysfunction, chronic insulin resistance, adipose tissue inflammation, and oxidative stress have been studied, the explicit pathogenesis of GDM remains unclear [7, 8].
Gut microbiota (GM) and microbial metabolites play important roles in maintaining host physiology and homeostasis and have been observed to change significantly during gestation. Mounting evidence demonstrated the gut microbiota dysbiosis in GDM patients [9], however, such findings differed across studies. Unlike other findings, Zhong et al. reported that Coprococcus decreases in GDM patients [10]. Karlsson et al. and Wu et al. found that Clostridium is a risk factor [11, 12], while Allin et al. reported the opposite result [13]. The interaction between the host and microbiota is primarily mediated by GM-derived metabolites. Numerous observational studies have indicated the association between GM-derived metabolites and GDM [14]. However, caution should be exercised in interpreting the association due to confounding factors and the complex environment of the human intestine, as well as the limitations of the observational study design.
Mendelian randomization (MR) is a useful approach to detect and quantify the causal effect of exposures on outcomes by using genetic variants as instrumental variables (IVs) [15]. Since alleles are randomly assigned from parents to offspring, freely combined, and genotypes remain stable after birth. MR, similar to a randomized controlled trial (RCT), can help minimize biases caused by traditional confounders (e.g., environmental exposures, demographic characteristics, and dietary habits) and reverse causation [16, 17]. Many studies have used MR analysis to explore the correlation among GM, GM-derived metabolites and complex human diseases such as metabolic diseases [18], neurodegenerative diseases [19], and adverse pregnancy outcomes [20]. Therefore, our study conducted bidirectional MR analyses using summary statistics from genome-wide association studies (GWAS) to investigate the causal relationship between GM, GM-derived metabolites, and GDM. This analysis may offer new insights into the underlying mechanism of GDM.
Results
A total of 7,121 SNPs associated with 119 bacterial genera were included for GM instruments, and 9,270 SNPs associated with 81 traits were identified for GM-derived metabolite instruments. Details of selected IVs in this study were shown in Supplementary Tables 1, 2.
Associations between GM and GDM
Figure 1 shows the results obtained using the IVW method at a significance threshold of P < 0.05. We identified significant positive associations between increases in Collinsella (OR, 1.322; 95%CI, 1.007-1.735; P < 0.001), Coprobacter (OR, 1.210; 95%CI, 1.037-1.412; P = 0.015), Olsenella (OR, 1.166; 95%CI, 1.030-1.321; P = 0.015), Lachnoclostridium (OR, 1.367; 95%CI, 1.057-1.767; P = 0.017), Prevotella9 (OR, 1.164; 95%CI, 1.010-1.342; P = 0.036), Ruminococcus2 (OR, 1.193; 95%CI, 1.003-1.418; P = 0.046) and a higher risk of GDM. Conversely, genetically increased levels of Oscillibacter (OR, 0.822; 95%CI, 0.706-0.957; P = 0.011) and Methanobrevibacter (OR, 0.850; 95%CI, 0.725-0.995; P = 0.043) were associated with a protective effect on GDM. Even after correcting for multiple comparisons, we observed a significant causal effect of increased Collinsella on the risk of GDM (q = 0.091). The F-statistics ranged from 20.39 to 336.56 in the aforementioned results, excluding the bias from weak instrumental variables. Additionally, we identified causal associations between GM and GDM risk in more than three MR methods, including IVW, MaxLik, WM, MR-Egger regression, and MR.RAPS (Table 1 and Figure 2).
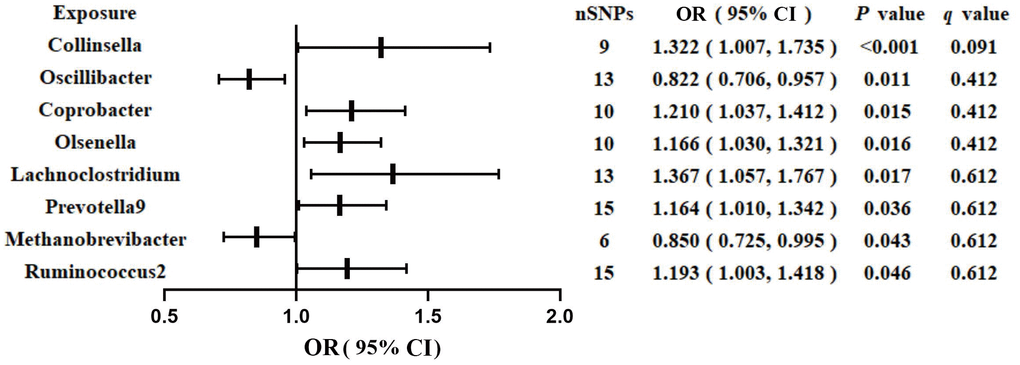
Figure 1. Associations of genetically predicted gut microbiota with risk of GDM using IVW method. OR, odds ratio; Cl, confidence interval.
Table 1. MR analyses of gut microbiota on GDM by different methods.
| Exposure | F statistics | Inverse variance weighted | | Maximum likelihood | | Weighted median | | MR.RAPS | | MR Egger |
| OR (95%CI) | P | OR (95%CI) | P | OR (95%CI) | P | OR (95%CI) | P | OR (95%CI) | P |
| Collinsella | 28.40 | 1.322 (1.007,1.735) | <0.001 | | 1.337 (1.023,1.746) | <0.001 | | 1.329 (0.916,1.928) | 0.010 | | 1.373 (1.082,1.742) | 0.012 | | 2.423 (0.902,6.506) | 0.123 |
| Oscillibacter | 27.30 | 0.822 (0.706,0.957) | 0.011 | | 0.819 (0.701,0.956) | 0.014 | | 0.788 (0.644,0.963) | 0.022 | | 0.847 (0.734,0.976) | 0.022 | | 1.068 (0.603,1.890) | 0.830 |
| Coprobacter | 26.02 | 1.210 (1.037,1.412) | 0.015 | | 1.213 (1.036,1.421) | 0.020 | | 1.250 (1.023,1.527) | 0.030 | | 1.170 (1.014,1.350) | 0.031 | | 1.522 (0.852,2.717) | 0.194 |
| Olsenella | 20.39 | 1.166 (1.029,1.321) | 0.017 | | 1.172 (1.046,1.314) | 0.017 | | 1.173 (1.006,1.367) | 0.041 | | 1.172 (1.042,1.319) | 0.013 | | 1.142 (0.747,1.745) | 0.573 |
| Lachnoclostridium | 24.83 | 1.367 (1.057,1.767) | 0.017 | | 1.393 (1.114,1.741) | <0.001 | | 1.313 (0.953,1.810) | 0.100 | | 1.340 (1.085,1.655) | 0.010 | | 1.485 (0.596,3.700) | 0.412 |
| Prevotella9 | 336.56 | 1.164 (1.010,1.342) | 0.036 | | 1.168 (1.011,1.349) | 0.036 | | 1.184 (0.981,1.430) | 0.081 | | 1.162 (1.013,1.334) | 0.033 | | 1.350 (0.893,2.043) | 0.183 |
| Methanobrevibacter | 27.75 | 0.850 (0.725,0.995) | 0.043 | | 0.845 (0.717,0.995) | 0.040 | | 0.889 (0.718,1.101) | 0.280 | | 0.871 (0.753,1.009) | 0.070 | | 0.514 (0.283,0.933) | 0.301 |
| Ruminococcus2 | 21.13 | 1.193 (1.003,1.418) | 0.046 | | 1.201 (1.009,1.428) | 0.045 | | 1.114 (0.865,1.436) | 0.410 | | 1.204 (1.008,1.437) | 0.043 | | 1.071 (0.698,1.643) | 0.760 |
| OR, odds ratio; CI, confidence interval; P, P value; MR, mendelian randomization; MR.RAPS, mendelian randomization robust adjusted profile score; GDM, gestational diabetes mellitus. |
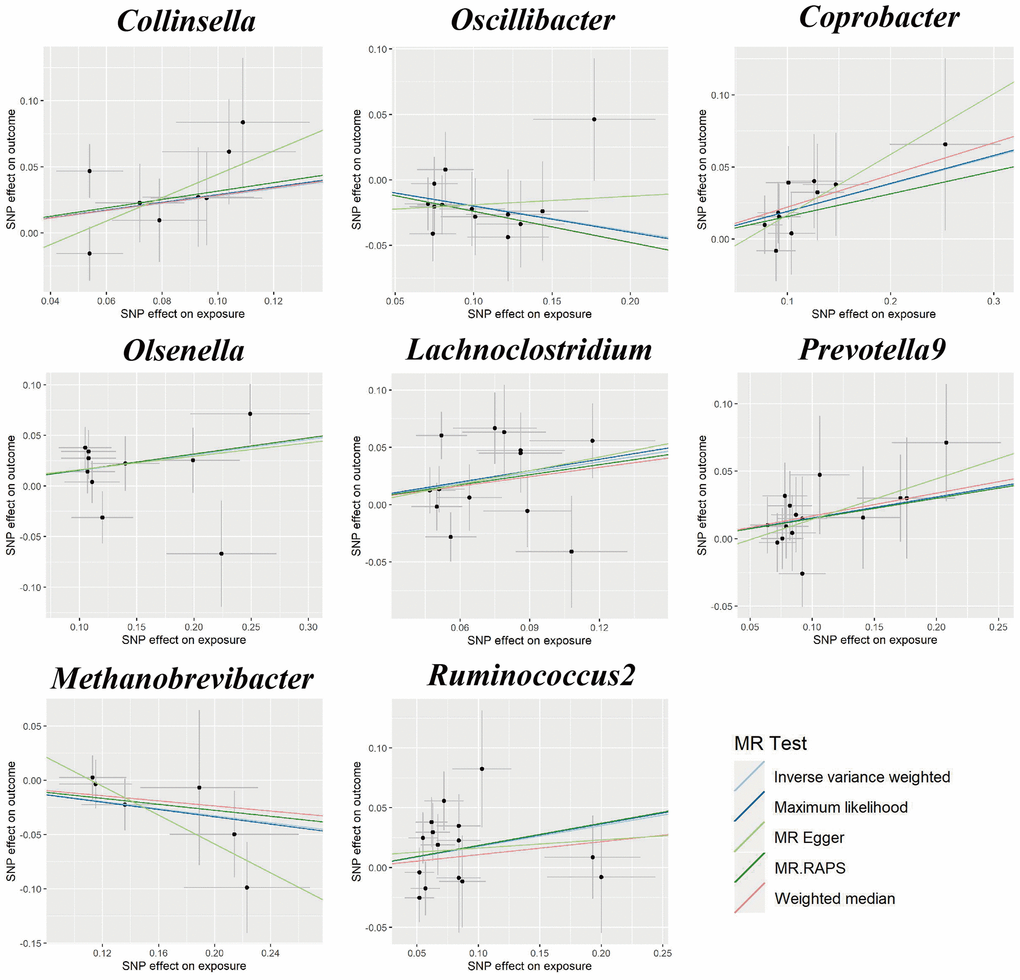
Figure 2. Scatter plots for the causal association between gut microbiota and GDM.
Cochran’s Q statistics showed no significant heterogeneity in selected IVs (P > 0.05 in IVW and MR-Egger methods, Supplementary Table 3). Both the MR-Egger intercept and the MR-PRESSO global test confirmed there are no significant directional horizontal pleiotropy (P > 0.05, Supplementary Table 3). Additionally, the leave-one-out analysis revealed that there are no outlier IVs that would have a significant impact on the result (Supplementary Figure 1).
All methods in reverse MR analysis showed no causal relationship from GDM to GM (P > 0.05, Supplementary Table 4). The sensitivity analyses including Cochran’s Q statistics, MR-Egger intercept, MR-PRESSO global test, and the leave-one-out analysis demonstrated the robustness of the reverse MR results (Supplementary Table 5 and Supplementary Figure 2).
The MVMR results demonstrated that, even after adjusting for confounding factors, including BMI (OR, 1.470; 95%CI, 1.137-1.901; P = 0.003), alcohol drinking (OR, 1.486; 95%CI, 1.116-1.980; P = 0.006), smoking (OR, 1.589; 95%CI, 1.192-2.119; P = 0.001), and hypertension (OR, 1.286; 95%CI, 1.034-1.599; P = 0.023), the genus Collinsella maintained its causal association with the risk of GDM and exhibited a more significant effect compared to the univariable MR analysis. Detailed MVMR results for other GM on GDM were shown in Table 2.
Table 2. Multivariable MR analyses of gut microbiota on GDM after adjusting confounding factors.
| Exposure | BMI | | Alcohol drinking | | Smoking | | Hypertension |
| OR (95%CI) | P | OR (95%CI) | P | OR (95%CI) | P | OR (95%CI) | P |
| Collinsella | 1.470(1.137,1.901) | 0.003 | | 1.486(1.116,1.980) | 0.006 | | 1.589(1.192,2.119) | 0.001 | | 1.286(1.034,1.599) | 0.023 |
| Oscillibacter | 1.265(1.190,1.344) | <0.001 | | 1.209(1.093,1.337) | <0.001 | | 1.144(1.036,1.265) | 0.008 | | 1.217(1.120,1.323) | <0.001 |
| Coprobacter | 1.378(0.881,2.154) | 0.160 | | 1.330(0.996,1.777) | 0.053 | | 1.319(1.029,1.689) | 0.029 | | 1.119(0.723,1.732) | 0.615 |
| Olsenella | 0.899(0.779,1.039) | 0.150 | | 0.838(0.722,0.972) | 0.020 | | 0.783(0.604,1.015) | 0.065 | | 0.817(0.666,1.002) | 0.053 |
| Lachnoclostridium | 1.200(0.974,1.477) | 0.086 | | 1.140(0.990,1.313) | 0.068 | | 1.175(1.021,1.352) | 0.025 | | 1.148(0.978,1.349) | 0.092 |
| Prevotella9 | 0.798(0.735,0.867) | <0.001 | | 0.849(0.756,0.954) | 0.006 | | 0.831(0.737,0.937) | 0.003 | | 0.814(0.716,0.926) | 0.002 |
| Methanobrevibacter | 1.138(1.033,1.255) | 0.009 | | 1.167(1.040,1.309) | 0.008 | | 1.150(1.042,1.269) | 0.006 | | 1.157(1.043,1.283) | 0.006 |
| Ruminococcus2 | 1.197(0.990,1.447) | 0.064 | | 1.263(1.023,1.599) | 0.030 | | 1.207(1.022,1.426) | 0.027 | | 1.096(0.875,1.374) | 0.424 |
| OR, odds ratio; CI, confidence interval; P, P value; MR, mendelian randomization; GDM, gestational diabetes mellitus; BMI, body mass index. |
Associations between GM-derived metabolites and GDM
We identified eight GM-derived metabolites that showed suggestive associations with GDM (P < 0.05, q > 0.1; Figure 3). Specifically, serine (OR, 2.545; 95%CI, 1.603-3.573; P = 0.001), indoleacetate (OR, 1.766; 95%CI, 1.054-2.958; P = 0.031), adrenate (OR, 1.859; 95%CI, 1.024-3.376; P = 0.042), and phenylacetate (OR, 1.624; 95%CI, 1.015-2.600; P = 0.043) were identified as risk factors for GDM, whereas pyruvate (OR, 0.519; 95%CI, 0.290-0.928; P = 0.027), pipecolate (OR, 0.531; 95%CI, 0.301-0.937; P = 0.029), glycodeoxycholate (OR, 0.780; 95%CI, 0.620-0.981; P = 0.034), and carnitine (OR, 0.479; 95%CI, 0.235-0.975; P = 0.042) were identified as protective factors for GDM. The F-statistics ranged from 15.70 to 65.99 in the aforementioned results, excluding the bias from weak instrumental variables. Furthermore, we explored causal associations between the GM-derived metabolites and GDM risk using more than three MR methods (Table 3 and Supplementary Figure 3). The sensitivity analyses demonstrated the robustness of the MR results (Supplementary Table 3 and Supplementary Figure 3, 4).
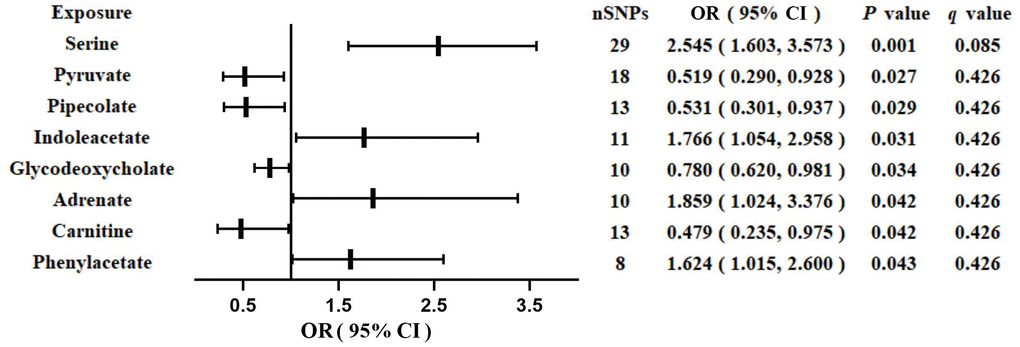
Figure 3. Associations of genetically predicted gut microbiota-derived metabolites with risk of GDM using IVW method. OR, odds ratio; CI, confidence interval.
Table 3. MR analyses of gut microbiota-derived metabolites on GDM by different methods.
| Exposure | F statistics | Inverse variance weighted | | Maximum likelihood | | Weighted median | | MR.RAPS | | MR Egger |
| OR (95%CI) | P | OR (95%CI) | P | OR (95%CI) | P | OR (95%CI) | P | OR (95%CI) | P |
| Serine | 34.57 | 2.545 (1.603,3.573) | 0.001 | | 2.403 (1.651,3.013) | 0.001 | | 2.663 (0.956,7.419) | 0.062 | | 2.584 (1.769,3.262) | 0.003 | | 1.391 (0.203,9.546) | 0.741 |
| Pyruvate | 17.55 | 0.519 (0.290,0.928) | 0.027 | | 0.528 (0.294,0.947) | 0.032 | | 0.391 (0.181,0.845) | 0.022 | | 0.486 (0.270,0.886)) | 0.021 | | 0.179 (0.033,0.977) | 0.075 |
| Pipecolate | 27.65 | 0.531 (0.301,0.937) | 0.029 | | 0.537 (0.297,0.974) | 0.043 | | 0.840 (0.380,1.855) | 0.671 | | 0.605 (0.358,1.023) | 0.063 | | 0.552 (0.099,3.96) | 0.522 |
| Indoleacetate | 43.73 | 1.766 (1.054,2.958) | 0.031 | | 1.617 (1.000,2.614) | 0.052 | | 1.754 (0.936,3.288) | 0.083 | | 1.607 (0.658,3.923) | 0.062 | | 1.741 (0.904,3.351) | 0.157 |
| Glycodeoxycholate | 15.70 | 0.780 (0.620,0.981) | 0.034 | | 0.775 (0.610,0.985) | 0.056 | | 0.764 (0.563,1.037) | 0.081 | | 0.835 (0.664,1.051) | 0.124 | | 0.676 (0.230,1.982) | 0.512 |
| Adrenate | 32.64 | 1.859 (1.024,3.376) | 0.042 | | 1.875 (1.022,3.440) | 0.042 | | 1.570 (0.732,3.371) | 0.251 | | 1.868 (1.005,3.474) | 0.054 | | 1.921 (0.423,8.630) | 0.425 |
| Carnitine | 65.99 | 0.479 (0.235,0.975) | 0.042 | | 0.480 (0.241,0.956) | 0.045 | | 0.515 (0.160,1.662) | 0.272 | | 0.522 (0.267,1.021) | 0.067 | | 1.026 (0.109,9.657) | 0.981 |
| Phenylacetate | 24.02 | 1.624 (1.015,2.600) | 0.043 | | 1.804 (1.142,2.849) | 0.016 | | 1.570 (0.732,3.371) | 0.251 | | 1.868 (1.005,3.474) | 0.054 | | 1.921 (0.423,8.630) | 0.425 |
| OR, odds ratio; CI, confidence interval; P, P value; MR, mendelian randomization; MR.RAPS, mendelian randomization robust adjusted profile score; GDM, gestational diabetes mellitus. |
We performed reverse MR analysis to assess whether GDM causally affect GM-derived metabolites and none of the methods indicated a causal relationship (Supplementary Table 6). The Cochran's Q test revealed heterogeneity of instrumental variables in serine and adrenate. The MR-Egger intercept and the MR-PRESSO global test suggested the presence of directional horizontal pleiotropy in pyruvate (Supplementary Table 5). The leave-one-out analysis confirmed there are no outlier IVs that would have a significant impact on the result (Supplementary Figure 5).
We performed an MVMR analysis to assess the causal effect of GM-derived metabolites on GDM after confounding factors adjusted. For the protect factor carnitine, after adjusting for BMI (OR, 0.733; 95%CI, 0.320-1.678; P = 0.462), alcohol drinking (OR, 0.754; 95%CI, 0.405-1.405; P = 0.374) smoking (OR, 0.725; 95%CI, 0.393-1.341; P = 0.306), and hypertension (OR, 0.626; 95%CI, 0.331-1.187; P = 0.152), the causal effect was no longer significant. Detailed MVMR results for other gut metabolites on GDM were shown in Table 4.
Table 4. Multivariable MR analyses of gut microbiota-derived metabolites on GDM after adjusting confounding factors.
| Exposure | BMI | | Alcohol drinking | | Smoking | | Hypertension |
| OR (95%CI) | P | OR (95%CI) | P | OR (95%CI) | P | OR (95%CI) | P |
| Serine | 5.125(2.142,12.261) | <0.001 | | 3.105(1.443,6.680) | 0.004 | | 2.324(1.042,5.184) | 0.039 | | 3.348(1.581,7.090) | 0.002 |
| Pyruvate | 0.424(0.214,0.839) | 0.014 | | 0.466(0.294,0.740) | 0.001 | | 0.678(0.352,1.309) | 0.247 | | 0.492(0.292,0.830) | 0.008 |
| Pipecolate | 0.542(0.327,0.899) | 0.018 | | 0.698(0.423,1.151) | 0.159 | | 0.669(0.398,1.123) | 0.128 | | 0.648(0.376,1.116) | 0.118 |
| Indoleacetate | 1.961(0.923,4.164) | 0.080 | | 1.684(1.047,2.708) | 0.032 | | 1.710(1.029,2.842) | 0.039 | | 1.813(1.144,2.875) | 0.011 |
| Glycodeoxycholate | 0.810(0.551,1.192) | 0.285 | | 1.058(0.770,1.454) | 0.727 | | 0.893(0.721,1.105) | 0.297 | | 0.623(0.556,0.699) | <0.001 |
| Adrenate | 2,277(1.686,3.076) | <0.001 | | 1.851(1.270,2.699) | 0.001 | | 1.878(1.310,2.692) | 0.001 | | 1.829(1.212,2.760) | 0.004 |
| Carnitine | 0.733(0.320,1.678) | 0.462 | | 0.754(0.405,1.405) | 0.374 | | 0.725(0.393,1.341) | 0.306 | | 0.626(0.331,1.187) | 0.152 |
| Phenylacetate | 1.184(0.637,2.202) | 0.594 | | 1.072(0.647,1.773) | 0.778 | | 1,791(1.372,2.339) | 0.000 | | 1.596(1.154,2.208) | 0.005 |
| OR, odds ratio; CI, confidence interval; P, P value; MR, mendelian randomization; GDM, gestational diabetes mellitus; BMI, body mass index. |
The metabolic pathway analysis shown that “Phenylalanine metabolism” and “Citrate cycle (TCA cycle)” pathways are associated with the risk of GDM (Supplementary Table 7).
Discussion
In this bidirectional MR study, we detected causal associations between specific bacterial genera and the risk of GDM. Accumulating evidence has shown significant dysbiosis of the gut microbiota in pregnant women with impaired glucose tolerance, which may contribute to the development of GDM. The gut bacteria associated with increased risk of GDM included Collinsella [21], Olsenella [22], Prevotella9 [23], Lachnoclostridium [24], and Ruminococcus2 [22]. While, beneficial butyrate-producing bacteria, such as Oscillibacter [22] and Methanobrevibacter [25] were found to have a protective effect on GDM. These results from epidemiology were consistent with our study. Specifically, our MR analysis found Collinsella is positively correlated with GDM. This association remained statistically significant even after adjusting for multiple comparisons and controlling for covariates such as BMI, alcohol drinking, smoking, and hypertension. Similar with our results, Zhang et al. and Zhong et al. reported an enrichment of Collinsella and its species Collinsella intestinalis in fecal samples from GDM pregnancies [10, 26]. Interestingly, another case-control study demonstrated the enrichment of Collinsella in GDM patients last to postpartum, suggesting its potential contribution to the long-term risk of type 2 diabetes [22]. Meanwhile, population-based studies have consistently reported a higher abundance of the Collinsella genus in individuals with type 2 diabetes, atherosclerosis, rheumatoid arthritis, and overweight individuals [26–28] as well as a positive correlation of the Collinsella with serum cholesterol was detected by mice model [29]. In vitro experiments have shown that Collinsella reduces the expression of the ZO-1 tight junction protein, thereby impairing the integrity of the intestinal barrier [28]. Increased gut permeability allows higher levels of lipopolysaccharide, produced by gut microbiota, to enter the bloodstream [30], which can lead to systemic inflammation. This may explain the potential mechanism through which Collinsella contributes to the development of these diseases [31]. All the evidence above suggests that the Collinsella could potentially serve as a novel target for the prevention and treatment of the aforementioned diseases. However, further functional experiments and RCTs are required to support this finding.
Regarding to gut metabolites, in this study, MR results showed suggestive evidence of genetically increased phenylacetic acid (PA) with a higher risk of GDM as well as the metabolic pathway analysis revealed that “Phenylalanine metabolism” pathway is closely related to GDM. In a nested case-control study involving 105 women in early pregnancy, it was found that GDM patients had significantly higher levels of PA compared to the control group [32]. This finding is consistent with previous research showing elevated levels of PA in patients with impaired fasting glucose, even after accounting for traditional risk factors [33]. PA is an organic compound primarily produced through microbial phenethylamine metabolism by bacteria [34, 35]. Once absorbed into the portal system, PA can be converted by the liver into phenylacetylglutamine (PAGln) [36]. A cohort study involving 1,797 female twins demonstrated an association between PAGln and the expression of the cell death activator CIDE-C, which plays a role in regulating insulin resistance in adipose tissue [37]. The expression of microbial PAGln-synthesis related enzyme genes was positively correlated with the absolute count of neutrophils, indicating systemic inflammation [38], and evidence indicated that inflammation status can trigger the onset of hyperglycemia [39]. Collectively, these findings provided evidence that PA and the "Phenylalanine metabolism" pathway may play a significant role in the pathogenesis of GDM. Additionally, we found a positive association between indole acetate and GDM. Zhu et al. developed a multi-metabolite model that accurately predicted the risk of GDM, including indole acetate [40], which supported our result.
Carnitine, a quaternary ammonium compound abundant in red meat [41] can be converted into trimethylamine-N-oxide (TMAO) through a microbiota-dependent mechanism [42]. Cellular and in vivo experiments supported the role of TMAO in inhibiting gluconeogenesis and increasing blood glucose by blocking the hepatic insulin signaling pathway [43, 44]. However, evidence from human studies is not always consistent. Several observational studies have suggested an increased risk of diabetes with elevated TMAO levels [45, 46], whereas cohort study and MR analysis indicated no association [19, 47]. Interestingly, we identified a protective effect of carnitine on GDM, which is supported by a prospective cohort study in China. This study found an inverse relationship between the concentration of L-carnitine and the risk of GDM, with a clear threshold effect [48]. However, in a birth cohort study conducted in Boston, the concentration of carnitine and other precursors of TMAO showed no association with GDM [49]. Additionally, our further multivariable MR analysis found no direct causal effect between carnitine and GDM after confounders adjusted. Considering the unclear mechanism, inconsistent results, and potential confounding factors, the causal relationship between carnitine and the risk of GDM should be interpreted with caution.
Our study has several strengths. Firstly, it is the first MR analysis to explore the possible causal associations among GM, GM-derived metabolites, and GDM. Secondly, the exposure and outcome data are derived from the largest GWAS conducted to date. Furthermore, we employed bidirectional MR, multivariable MR, and several sensitivity analyses, which enhance the robustness of our findings. Thirdly, confounding variables and reverse causation are less likely to have an impact on the causal associations. Therefore, our study may offer potential gut biomarkers that can be further investigated in functional studies related to GDM.
Apparently, there are still some limitations. Firstly, we set the significance threshold of exposure instrumental variables (IVs) at 1e-05 due to the limited number of IVs meeting genome-wide significance criteria. However, we tested the F-statistics to avoid the weak instrumental bias. Secondly, the original GWAS population is predominantly of European descent, thus limiting the generalizability of our findings to other ethnicities. Thirdly, due to the limited resolution of 16S rRNA sequencing, our MR analyses were performed at the bacterial genus level rather than at a more specific species level. Finally, although GM and GM-derived metabolites may be influenced by dietary habits, we were unable to account for these confounding factors in the multivariable MR analysis due to the lack of publicly available GWAS on dietary habits.
In conclusion, our study employed bidirectional MR analyses on GWAS summary data to comprehensively investigate the causal effects of gut microbiota and gut microbiota-derived metabolites on GDM. Our findings offer valuable insights into the mechanisms of GDM and may contribute to the development of prevention and treatment strategies targeting gut biomarkers. However, further studies are needed to validate these results.
Materials and Methods
Data sources
The GM dataset conducted by the Microbiome Genome (MiBioGen) consortium consists of 24 multiple ancestry cohorts including 18,340 subjects [50]. After extracting DNA from fecal samples, data was generated by the Illumina platform. Setting SILVA database as the reference, 16S rRNA gene sequencing pipeline was conducted to profile the microbial composition [51], with the annotation to genus and higher level.
Genetic variants for gut metabolites were collected from a pooled dataset of 7,824 European ancestry participants (TwinsUK and KORA cohorts), which tested 486 metabolite concentrations after sex and age corrected [52]. Then we manually checked HMDB database to obtain a list of 81 GM-derived metabolites (i.e., butyric acid, choline, glutamate, kynurenine, tyrosine) from all the quantified metabolites in the GWAS which includes summary data [53].
GWAS summary statistics for GDM was extracted from the FinnGen consortium included 123,579 female subjects (5,687 cases and 117,892 controls) [54]. These individuals were genotyped using Illumina and Affymetrix chips arrays, and 16,379,784 variants were analyzed in total. Association analysis was conducted with sex, age, genotyping batch, and 10 principal components as covariates. Details of GM, GM-derived metabolites, and GDM GWAS datasets used in this study were listed in Supplementary Table 8.
Instrumental variables
Five steps were applied to select the optimal IVs: (1) SNPs under a locus-wide significance threshold of P < 1e-05 were obtained as potential IVs related to each exposure traits, respectively [18]. (2) Linkage disequilibrium (LD) based clumping was performed to ensure the potential IVs are independent (r2 < 0.001, window size = 10,000 kb) [55]. (3) SNPs with minor allele frequency < 0.01 and palindromic SNPs were excluded. (4) The proxy SNPs (r2 > 0.8) were selected based on European population data in the 1000 Genome project after removing the SNPs closely related to the outcome phenotype (P < 5e-08) [56]. (5) SNPs with F-statistics < 10 were excluded to avoid the weak instrumental bias [57].
Statistical analyses
We used the inverse-variance weighted (IVW) method as the primary MR analysis to detect the causal association between exposure (GM, GM-derived metabolites) and outcome (GDM). The IVW method calculates the total causal effect by using the weighted linear regression model combined with the weight coefficient, under the condition that the intercept is zero [58]. IVW results were corrected for multiple comparisons applying the q-value procedure (q < 0.1), while P < 0.05 but q > 0.1 was considered to have a suggestive association [59]. After IVW analysis, GM and metabolites that were found to be causally related to GDM would be selected for further analyses.
Several MR methods including maximum Likelihood (MaxLik), weighted median (WM), MR-Egger regression and MR robust adjusted profile score (MR.RAPS) were also conducted to test the robustness of our study. MaxLik estimates the parameter values that have the greatest likelihood of leading to a particular outcome by using the known sample. Its standard error would be lower than IVW when heterogeneity and horizontal pleiotropy do not exist [60]. WM improves the power of causality detection based on the assumption that up to 50% IVs are valid [61]. MR-Egger regression method could identify and correct pleiotropy, but the estimation accuracy will be very low unless using a larger sample size [62]. MR.RAPS applies robust estimates to correct for systematic and idiosyncratic pleiotropy, the results of which are unbiased even though weak IVs exist [63].
Cochran’s IVW Q statistics and leave-one-out analysis were used to identify potential heterogeneous IVs. MR-Egger intercept and MR Pleiotropy RESidual Sum and Outlier (MR-PRESSO) global test were conducted to test whether directional horizontal pleiotropy is driving the results of MR analyses [64, 65].
Reverse MR analysis was used to confirm the direction of causality. The methods were similar to forward MR, except for setting GDM as the exposure and GM or GM-derived metabolites as the outcomes. Finally, we conducted multivariable MR (MVMR) analysis, taking into account potential confounders that might influence the outcome. Specifically, four confounders including BMI, alcohol drinking, smoking, and hypertension were adjusted in MVMR, respectively.
For GM-derived metabolites that achieved the significant threshold of P < 0.05 by IVW method, we used MetaboAnlyst software to conduct the metabolic pathway analysis [66].
Flowchart of this study was shown in Figure 4. All MR analyses were performed by the packages “TwoSampleMR”, “MRPRESSO”, and “qvalue” in R software.
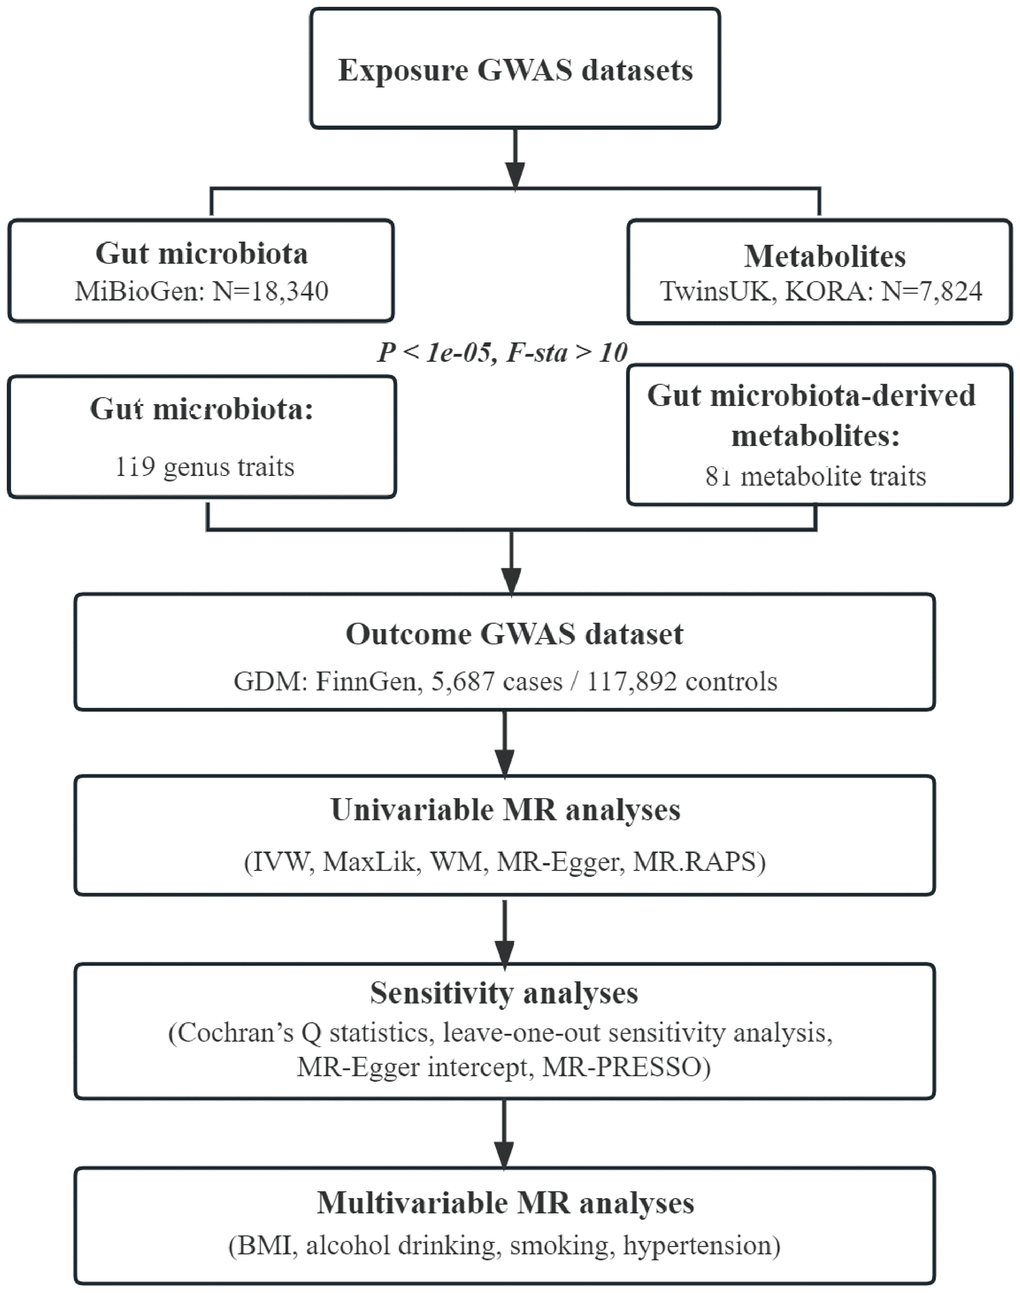
Figure 4. Flowchart of this study. GWAS, genome-wide association study; GDM, gestational diabetes mellitus; IVW, inverse-variance weighted; MaxLik, maximum likelihood; WM, weighted median; MR.RAPS, mendelian randomization robust adjusted profile score; MR-PRESSO, mendelian randomization pleiotropy residual sum and outlier; BMI, body mass index.
Consent for publication
All the authors endorsed the publication of the manuscript.
Abbreviations
GDM: Gestational diabetes mellitus;
GM: Gut microbiota;
MR: Mendelian randomization;
IV: instrumental variable;
RCT: randomized controlled trial;
GWAS: genome-wide association study;
IVW: inverse-variance weighted;
MaxLik: maximum likelihood;
WM: weighted median;
MR.RAPS: Mendelian randomization robust adjusted profile score;
MR-PRESSO: Mendelian randomization Pleiotropy RESidual Sum and Outlier;
MVMR: multivariable Mendelian randomization;
BMI: body mass index;
OR: odds ratio;
CI: confidence interval;
PA: phenylacetic acid;
PAGln: phenylacetylglutamine;
TMAO: trimethylamine-N-oxide.
Author Contributions
XW conceived the study, analyzed and interpreted the data. XW and DL composed the article. QL and JC performed the statistical analysis. HH and TX prepared the figures and tables. HT conceived the study and reviewed the article. All authors approved the submitted version.
Conflicts of Interest
The authors declared there are no conflicts of interest exist.
Funding
This work was supported by the Key Research and Development Program of Hunan Province (2018SK2061), the Natural Science Foundation of Hunan Province (2022JJ40343), the Scientific Research Project of Education Department of Hunan Province (21B0513), the Scientific Research Project of Hunan Provincial Health Commission (202212053368).
References
-
1.
Zhu Y, Zhang C. Prevalence of Gestational Diabetes and Risk of Progression to Type 2 Diabetes: a Global Perspective. Curr Diab Rep. 2016; 16:7. https://doi.org/10.1007/s11892-015-0699-x [PubMed]
-
2.
Metzger BE, Lowe LP, Dyer AR, Trimble ER, Chaovarindr U, Coustan DR, Hadden DR, McCance DR, Hod M, McIntyre HD, Oats JJ, Persson B, Rogers MS, Sacks DA, and HAPO Study Cooperative Research Group. Hyperglycemia and adverse pregnancy outcomes. N Engl J Med. 2008; 358:1991–2002. https://doi.org/10.1056/NEJMoa0707943 [PubMed]
-
3.
Mitanchez D. Foetal and neonatal complications in gestational diabetes: perinatal mortality, congenital malformations, macrosomia, shoulder dystocia, birth injuries, neonatal complications. Diabetes Metab. 2010; 36:617–27. https://doi.org/10.1016/j.diabet.2010.11.013 [PubMed]
-
4.
Kampmann U, Madsen LR, Skajaa GO, Iversen DS, Moeller N, Ovesen P. Gestational diabetes: A clinical update. World J Diabetes. 2015; 6:1065–72. https://doi.org/10.4239/wjd.v6.i8.1065 [PubMed]
-
5.
Bellamy L, Casas JP, Hingorani AD, Williams D. Type 2 diabetes mellitus after gestational diabetes: a systematic review and meta-analysis. Lancet. 2009; 373:1773–9. https://doi.org/10.1016/S0140-6736(09)60731-5 [PubMed]
-
6.
Dabelea D, Pettitt DJ. Intrauterine diabetic environment confers risks for type 2 diabetes mellitus and obesity in the offspring, in addition to genetic susceptibility. J Pediatr Endocrinol Metab. 2001; 14:1085–91. https://doi.org/10.1515/jpem-2001-0803 [PubMed]
-
7.
Kühl C, Hornnes PJ, Andersen O. Etiology and pathophysiology of gestational diabetes mellitus. Diabetes. 1985 (Suppl 2); 34:66–70. https://doi.org/10.2337/diab.34.2.s66 [PubMed]
-
8.
Plows JF, Stanley JL, Baker PN, Reynolds CM, Vickers MH. The Pathophysiology of Gestational Diabetes Mellitus. Int J Mol Sci. 2018; 19:3342. https://doi.org/10.3390/ijms19113342 [PubMed]
-
9.
Letchumanan G, Abdullah N, Marlini M, Baharom N, Lawley B, Omar MR, Mohideen FBS, Addnan FH, Nur Fariha MM, Ismail Z, Pathmanathan SG. Gut Microbiota Composition in Prediabetes and Newly Diagnosed Type 2 Diabetes: A Systematic Review of Observational Studies. Front Cell Infect Microbiol. 2022; 12:943427. https://doi.org/10.3389/fcimb.2022.943427 [PubMed]
-
10.
Zhong H, Ren H, Lu Y, Fang C, Hou G, Yang Z, Chen B, Yang F, Zhao Y, Shi Z, Zhou B, Wu J, Zou H, et al. Distinct gut metagenomics and metaproteomics signatures in prediabetics and treatment-naïve type 2 diabetics. EBioMedicine. 2019; 47:373–83. https://doi.org/10.1016/j.ebiom.2019.08.048 [PubMed]
-
11.
Karlsson FH, Tremaroli V, Nookaew I, Bergström G, Behre CJ, Fagerberg B, Nielsen J, Bäckhed F. Gut metagenome in European women with normal, impaired and diabetic glucose control. Nature. 2013; 498:99–103. https://doi.org/10.1038/nature12198 [PubMed]
-
12.
Wu H, Tremaroli V, Schmidt C, Lundqvist A, Olsson LM, Krämer M, Gummesson A, Perkins R, Bergström G, Bäckhed F. The Gut Microbiota in Prediabetes and Diabetes: A Population-Based Cross-Sectional Study. Cell Metab. 2020; 32:379–90.e3. https://doi.org/10.1016/j.cmet.2020.06.011 [PubMed]
-
13.
Allin KH, Tremaroli V, Caesar R, Jensen BAH, Damgaard MTF, Bahl MI, Licht TR, Hansen TH, Nielsen T, Dantoft TM, Linneberg A, Jørgensen T, Vestergaard H, et al, and IMI-DIRECT consortium. Aberrant intestinal microbiota in individuals with prediabetes. Diabetologia. 2018; 61:810–20. https://doi.org/10.1007/s00125-018-4550-1 [PubMed]
-
14.
Agus A, Clément K, Sokol H. Gut microbiota-derived metabolites as central regulators in metabolic disorders. Gut. 2021; 70:1174–82. https://doi.org/10.1136/gutjnl-2020-323071 [PubMed]
-
15.
Smith GD, Ebrahim S. ‘Mendelian randomization’: can genetic epidemiology contribute to understanding environmental determinants of disease? Int J Epidemiol. 2003; 32:1–22. https://doi.org/10.1093/ije/dyg070 [PubMed]
-
16.
Lawlor DA, Harbord RM, Sterne JA, Timpson N, Davey Smith G. Mendelian randomization: using genes as instruments for making causal inferences in epidemiology. Stat Med. 2008; 27:1133–63. https://doi.org/10.1002/sim.3034 [PubMed]
-
17.
Didelez V, Sheehan N. Mendelian randomization as an instrumental variable approach to causal inference. Stat Methods Med Res. 2007; 16:309–30. https://doi.org/10.1177/0962280206077743 [PubMed]
-
18.
Sanna S, van Zuydam NR, Mahajan A, Kurilshikov A, Vich Vila A, Võsa U, Mujagic Z, Masclee AAM, Jonkers DM, Oosting M, Joosten LAB, Netea MG, Franke L, et al. Causal relationships among the gut microbiome, short-chain fatty acids and metabolic diseases. Nat Genet. 2019; 51:600–5. https://doi.org/10.1038/s41588-019-0350-x [PubMed]
-
19.
Jia J, Dou P, Gao M, Kong X, Li C, Liu Z, Huang T. Assessment of Causal Direction Between Gut Microbiota-Dependent Metabolites and Cardiometabolic Health: A Bidirectional Mendelian Randomization Analysis. Diabetes. 2019; 68:1747–55. https://doi.org/10.2337/db19-0153 [PubMed]
-
20.
Li C, Liu C, Li N. Causal associations between gut microbiota and adverse pregnancy outcomes: A two-sample Mendelian randomization study. Front Microbiol. 2022; 13:1059281. https://doi.org/10.3389/fmicb.2022.1059281 [PubMed]
-
21.
Chang Y, Chen Y, Zhou Q, Wang C, Chen L, Di W, Zhang Y. Short-chain fatty acids accompanying changes in the gut microbiome contribute to the development of hypertension in patients with preeclampsia. Clin Sci (Lond). 2020; 134:289–302. https://doi.org/10.1042/CS20191253 [PubMed]
-
22.
Crusell MKW, Hansen TH, Nielsen T, Allin KH, Rühlemann MC, Damm P, Vestergaard H, Rørbye C, Jørgensen NR, Christiansen OB, Heinsen FA, Franke A, Hansen T, et al. Gestational diabetes is associated with change in the gut microbiota composition in third trimester of pregnancy and postpartum. Microbiome. 2018; 6:89. https://doi.org/10.1186/s40168-018-0472-x [PubMed]
-
23.
Hasain Z, Mokhtar NM, Kamaruddin NA, Mohamed Ismail NA, Razalli NH, Gnanou JV, Raja Ali RA. Gut Microbiota and Gestational Diabetes Mellitus: A Review of Host-Gut Microbiota Interactions and Their Therapeutic Potential. Front Cell Infect Microbiol. 2020; 10:188. https://doi.org/10.3389/fcimb.2020.00188 [PubMed]
-
24.
Liang YY, Liu LY, Jia Y, Li Y, Cai JN, Shu Y, Tan JY, Chen PY, Li HW, Cai HH, Cai XS. Correlation between gut microbiota and glucagon-like peptide-1 in patients with gestational diabetes mellitus. World J Diabetes. 2022; 13:861–76. https://doi.org/10.4239/wjd.v13.i10.861 [PubMed]
-
25.
Kuang YS, Lu JH, Li SH, Li JH, Yuan MY, He JR, Chen NN, Xiao WQ, Shen SY, Qiu L, Wu YF, Hu CY, Wu YY, et al. Connections between the human gut microbiome and gestational diabetes mellitus. Gigascience. 2017; 6:1–12. https://doi.org/10.1093/gigascience/gix058 [PubMed]
-
26.
Zhang X, Shen D, Fang Z, Jie Z, Qiu X, Zhang C, Chen Y, Ji L. Human gut microbiota changes reveal the progression of glucose intolerance. PLoS One. 2013; 8:e71108. https://doi.org/10.1371/journal.pone.0071108 [PubMed]
-
27.
Karlsson FH, Fåk F, Nookaew I, Tremaroli V, Fagerberg B, Petranovic D, Bäckhed F, Nielsen J. Symptomatic atherosclerosis is associated with an altered gut metagenome. Nat Commun. 2012; 3:1245. https://doi.org/10.1038/ncomms2266 [PubMed]
-
28.
Chen J, Wright K, Davis JM, Jeraldo P, Marietta EV, Murray J, Nelson H, Matteson EL, Taneja V. An expansion of rare lineage intestinal microbes characterizes rheumatoid arthritis. Genome Med. 2016; 8:43. https://doi.org/10.1186/s13073-016-0299-7 [PubMed]
-
29.
Behrens M, Trejo T, Luthra H, Griffiths M, David CS, Taneja V. Mechanism by which HLA-DR4 regulates sex-bias of arthritis in humanized mice. J Autoimmun. 2010; 35:1–9. https://doi.org/10.1016/j.jaut.2009.12.007 [PubMed]
-
30.
Johansson ME, Jakobsson HE, Holmén-Larsson J, Schütte A, Ermund A, Rodríguez-Piñeiro AM, Arike L, Wising C, Svensson F, Bäckhed F, Hansson GC. Normalization of Host Intestinal Mucus Layers Requires Long-Term Microbial Colonization. Cell Host Microbe. 2015; 18:582–92. https://doi.org/10.1016/j.chom.2015.10.007 [PubMed]
-
31.
Fan M, Li X, Gao X, Dong L, Xin G, Chen L, Qiu J, Xu Y. LPS Induces Preeclampsia-Like Phenotype in Rats and HTR8/SVneo Cells Dysfunction Through TLR4/p38 MAPK Pathway. Front Physiol. 2019; 10:1030. https://doi.org/10.3389/fphys.2019.01030 [PubMed]
-
32.
Tian M, Ma S, You Y, Long S, Zhang J, Guo C, Wang X, Tan H. Serum Metabolites as an Indicator of Developing Gestational Diabetes Mellitus Later in the Pregnancy: A Prospective Cohort of a Chinese Population. J Diabetes Res. 2021; 2021:8885954. https://doi.org/10.1155/2021/8885954 [PubMed]
-
33.
Kim M, Kim M, Han JY, Lee SH, Jee SH, Lee JH. The metabolites in peripheral blood mononuclear cells showed greater differences between patients with impaired fasting glucose or type 2 diabetes and healthy controls than those in plasma. Diab Vasc Dis Res. 2017; 14:130–8. https://doi.org/10.1177/1479164116678157 [PubMed]
-
34.
Dodd D, Spitzer MH, Van Treuren W, Merrill BD, Hryckowian AJ, Higginbottom SK, Le A, Cowan TM, Nolan GP, Fischbach MA, Sonnenburg JL. A gut bacterial pathway metabolizes aromatic amino acids into nine circulating metabolites. Nature. 2017; 551:648–52. https://doi.org/10.1038/nature24661 [PubMed]
-
35.
Elsden SR, Hilton MG, Waller JM. The end products of the metabolism of aromatic amino acids by Clostridia. Arch Microbiol. 1976; 107:283–8. https://doi.org/10.1007/BF00425340 [PubMed]
-
36.
Fu Y, Yang Y, Fang C, Liu X, Dong Y, Xu L, Chen M, Zuo K, Wang L. Prognostic value of plasma phenylalanine and gut microbiota-derived metabolite phenylacetylglutamine in coronary in-stent restenosis. Front Cardiovasc Med. 2022; 9:944155. https://doi.org/10.3389/fcvm.2022.944155 [PubMed]
-
37.
Menni C, Mangino M, Cecelja M, Psatha M, Brosnan MJ, Trimmer J, Mohney RP, Chowienczyk P, Padmanabhan S, Spector TD, Valdes AM. Metabolomic study of carotid-femoral pulse-wave velocity in women. J Hypertens. 2015; 33:791–6. https://doi.org/10.1097/HJH.0000000000000467 [PubMed]
-
38.
Fang C, Zuo K, Fu Y, Li J, Wang H, Xu L, Yang X. Dysbiosis of Gut Microbiota and Metabolite Phenylacetylglutamine in Coronary Artery Disease Patients With Stent Stenosis. Front Cardiovasc Med. 2022; 9:832092. https://doi.org/10.3389/fcvm.2022.832092 [PubMed]
-
39.
Spranger J, Kroke A, Möhlig M, Hoffmann K, Bergmann MM, Ristow M, Boeing H, Pfeiffer AF. Inflammatory cytokines and the risk to develop type 2 diabetes: results of the prospective population-based European Prospective Investigation into Cancer and Nutrition (EPIC)-Potsdam Study. Diabetes. 2003; 52:812–7. https://doi.org/10.2337/diabetes.52.3.812 [PubMed]
-
40.
Zhu Y, Barupal DK, Ngo AL, Quesenberry CP, Feng J, Fiehn O, Ferrara A. Predictive Metabolomic Markers in Early to Mid-pregnancy for Gestational Diabetes Mellitus: A Prospective Test and Validation Study. Diabetes. 2022; 71:1807–17. https://doi.org/10.2337/db21-1093 [PubMed]
-
41.
Koeth RA, Wang Z, Levison BS, Buffa JA, Org E, Sheehy BT, Britt EB, Fu X, Wu Y, Li L, Smith JD, DiDonato JA, Chen J, et al. Intestinal microbiota metabolism of L-carnitine, a nutrient in red meat, promotes atherosclerosis. Nat Med. 2013; 19:576–85. https://doi.org/10.1038/nm.3145 [PubMed]
-
42.
Gatarek P, Kaluzna-Czaplinska J. Trimethylamine N-oxide (TMAO) in human health. EXCLI J. 2021; 20:301–19. https://doi.org/10.17179/excli2020-3239 [PubMed]
-
43.
Shih DM, Wang Z, Lee R, Meng Y, Che N, Charugundla S, Qi H, Wu J, Pan C, Brown JM, Vallim T, Bennett BJ, Graham M, et al. Flavin containing monooxygenase 3 exerts broad effects on glucose and lipid metabolism and atherosclerosis. J Lipid Res. 2015; 56:22–37. https://doi.org/10.1194/jlr.M051680 [PubMed]
-
44.
Gao X, Liu X, Xu J, Xue C, Xue Y, Wang Y. Dietary trimethylamine N-oxide exacerbates impaired glucose tolerance in mice fed a high fat diet. J Biosci Bioeng. 2014; 118:476–81. https://doi.org/10.1016/j.jbiosc.2014.03.001 [PubMed]
-
45.
Dambrova M, Latkovskis G, Kuka J, Strele I, Konrade I, Grinberga S, Hartmane D, Pugovics O, Erglis A, Liepinsh E. Diabetes is Associated with Higher Trimethylamine N-oxide Plasma Levels. Exp Clin Endocrinol Diabetes. 2016; 124:251–6. https://doi.org/10.1055/s-0035-1569330 [PubMed]
-
46.
Shan Z, Sun T, Huang H, Chen S, Chen L, Luo C, Yang W, Yang X, Yao P, Cheng J, Hu FB, Liu L. Association between microbiota-dependent metabolite trimethylamine-N-oxide and type 2 diabetes. Am J Clin Nutr. 2017; 106:888–94. https://doi.org/10.3945/ajcn.117.157107 [PubMed]
-
47.
Papandreou C, Bulló M, Zheng Y, Ruiz-Canela M, Yu E, Guasch-Ferré M, Toledo E, Clish C, Corella D, Estruch R, Ros E, Fitó M, Arós F, et al. Plasma trimethylamine-N-oxide and related metabolites are associated with type 2 diabetes risk in the Prevención con Dieta Mediterránea (PREDIMED) trial. Am J Clin Nutr. 2018; 108:163–73. https://doi.org/10.1093/ajcn/nqy058 [PubMed]
-
48.
Huo X, Li J, Cao YF, Li SN, Shao P, Leng J, Li W, Liu J, Yang K, Ma RC, Hu G, Fang ZZ, Yang X. Trimethylamine N-Oxide Metabolites in Early Pregnancy and Risk of Gestational Diabetes: A Nested Case-Control Study. J Clin Endocrinol Metab. 2019; 104:5529–39. https://doi.org/10.1210/jc.2019-00710 [PubMed]
-
49.
McArthur KL, Zhang M, Hong X, Wang G, Buckley JP, Wang X, Mueller NT. Trimethylamine N-Oxide and Its Precursors Are Associated with Gestational Diabetes Mellitus and Pre-Eclampsia in the Boston Birth Cohort. Curr Dev Nutr. 2022; 6:nzac108. https://doi.org/10.1093/cdn/nzac108 [PubMed]
-
50.
Kurilshikov A, Medina-Gomez C, Bacigalupe R, Radjabzadeh D, Wang J, Demirkan A, Le Roy CI, Raygoza Garay JA, Finnicum CT, Liu X, Zhernakova DV, Bonder MJ, Hansen TH, et al. Large-scale association analyses identify host factors influencing human gut microbiome composition. Nat Genet. 2021; 53:156–65. https://doi.org/10.1038/s41588-020-00763-1 [PubMed]
-
51.
Quast C, Pruesse E, Yilmaz P, Gerken J, Schweer T, Yarza P, Peplies J, Glöckner FO. The SILVA ribosomal RNA gene database project: improved data processing and web-based tools. Nucleic Acids Res. 2013; 41:D590–6. https://doi.org/10.1093/nar/gks1219 [PubMed]
-
52.
Shin SY, Fauman EB, Petersen AK, Krumsiek J, Santos R, Huang J, Arnold M, Erte I, Forgetta V, Yang TP, Walter K, Menni C, Chen L, et al, and Multiple Tissue Human Expression Resource (MuTHER) Consortium. An atlas of genetic influences on human blood metabolites. Nat Genet. 2014; 46:543–50. https://doi.org/10.1038/ng.2982 [PubMed]
-
53.
Wishart DS, Feunang YD, Marcu A, Guo AC, Liang K, Vázquez-Fresno R, Sajed T, Johnson D, Li C, Karu N, Sayeeda Z, Lo E, Assempour N, et al. HMDB 4.0: the human metabolome database for 2018. Nucleic Acids Res. 2018; 46:D608–17. https://doi.org/10.1093/nar/gkx1089 [PubMed]
-
54.
Kurki MI, Karjalainen J, Palta P, Sipilä TP, Kristiansson K, Donner KM, Reeve MP, Laivuori H, Aavikko M, Kaunisto MA, Loukola A, Lahtela E, Mattsson H, et al. FinnGen provides genetic insights from a well-phenotyped isolated population. Nature. 2023; 613:508–18. https://doi.org/10.1038/s41586-022-05473-8 [PubMed] Erratum in: Nature. 2023; 615:E19. https://doi.org/10.1038/s41586-023-05837-8 [PubMed]
-
55.
Purcell S, Neale B, Todd-Brown K, Thomas L, Ferreira MA, Bender D, Maller J, Sklar P, de Bakker PI, Daly MJ, Sham PC. PLINK: a tool set for whole-genome association and population-based linkage analyses. Am J Hum Genet. 2007; 81:559–75. https://doi.org/10.1086/519795 [PubMed]
-
56.
Johnson AD, Handsaker RE, Pulit SL, Nizzari MM, O’Donnell CJ, de Bakker PI. SNAP: a web-based tool for identification and annotation of proxy SNPs using HapMap. Bioinformatics. 2008; 24:2938–9. https://doi.org/10.1093/bioinformatics/btn564 [PubMed]
-
57.
Burgess S, Thompson SG, and CRP CHD Genetics Collaboration. Avoiding bias from weak instruments in Mendelian randomization studies. Int J Epidemiol. 2011; 40:755–64. https://doi.org/10.1093/ije/dyr036 [PubMed]
-
58.
Burgess S, Butterworth A, Thompson SG. Mendelian randomization analysis with multiple genetic variants using summarized data. Genet Epidemiol. 2013; 37:658–65. https://doi.org/10.1002/gepi.21758 [PubMed]
-
59.
Storey JD, Tibshirani R. Statistical significance for genomewide studies. Proc Natl Acad Sci USA. 2003; 100:9440–5. https://doi.org/10.1073/pnas.1530509100 [PubMed]
-
60.
Luque-Fernandez MA, Schomaker M, Rachet B, Schnitzer ME. Targeted maximum likelihood estimation for a binary treatment: A tutorial. Stat Med. 2018; 37:2530–46. https://doi.org/10.1002/sim.7628 [PubMed]
-
61.
Bowden J, Davey Smith G, Haycock PC, Burgess S. Consistent Estimation in Mendelian Randomization with Some Invalid Instruments Using a Weighted Median Estimator. Genet Epidemiol. 2016; 40:304–14. https://doi.org/10.1002/gepi.21965 [PubMed]
-
62.
Bowden J, Davey Smith G, Burgess S. Mendelian randomization with invalid instruments: effect estimation and bias detection through Egger regression. Int J Epidemiol. 2015; 44:512–25. https://doi.org/10.1093/ije/dyv080 [PubMed]
-
63.
Zhao Q, Wang J, Hemani G, Bowden J, Small DS. Statistical inference in two-sample summary-data Mendelian randomization using robust adjusted profile score. The Annals of Statistics. 2020; 48. https://doi.org/10.1214/19-AOS1866
-
64.
Verbanck M, Chen CY, Neale B, Do R. Detection of widespread horizontal pleiotropy in causal relationships inferred from Mendelian randomization between complex traits and diseases. Nat Genet. 2018; 50:693–8. https://doi.org/10.1038/s41588-018-0099-7 [PubMed]
-
65.
Rees JMB, Wood AM, Burgess S. Extending the MR-Egger method for multivariable Mendelian randomization to correct for both measured and unmeasured pleiotropy. Stat Med. 2017; 36:4705–18. https://doi.org/10.1002/sim.7492 [PubMed]
-
66.
Chong J, Soufan O, Li C, Caraus I, Li S, Bourque G, Wishart DS, Xia J. MetaboAnalyst 4.0: towards more transparent and integrative metabolomics analysis. Nucleic Acids Res. 2018; 46:W486–94. https://doi.org/10.1093/nar/gky310 [PubMed]