Impact of E-cadherin expression on OS
As indicated in Figures 2–4 and Table 2, there are predominant correlations between reduced E-cadherin and poor one-, three-, and five-year OS, respectively (n = 25 studies [12, 13, 15–20, 22–24, 27–30, 35–37, 40–46], OR: 0.38, 95% CI: 0.25–0.57, Z = 4.61, P < 0.00001; n = 25 studies [12, 13, 15–20, 22–24, 27–30, 35–37, 40–46], OR: 0.33, 95% CI: 0.23–0.47, Z = 6.22, P < 0.00001; n = 22 studies [13, 16–20, 22, 24, 27–30, 35–37, 40–46], OR: 0.27, 95% CI: 0.18–0.41, Z = 6.23, P < 0.00001, respectively). The I2 statistic of the one-, three-, five-year OS was 77%, 82%, 85% respectively. The results of subgroup analyses revealed that reduced E-cadherin was predominantly associated with three-, five-year OS of patients with GC in China, Japan and Korea, as well as one-year OS of patients with GC in Japan, as illustrated in Table 3. It was concluded that reduced E-cad had a worse impact on prognosis in GC.
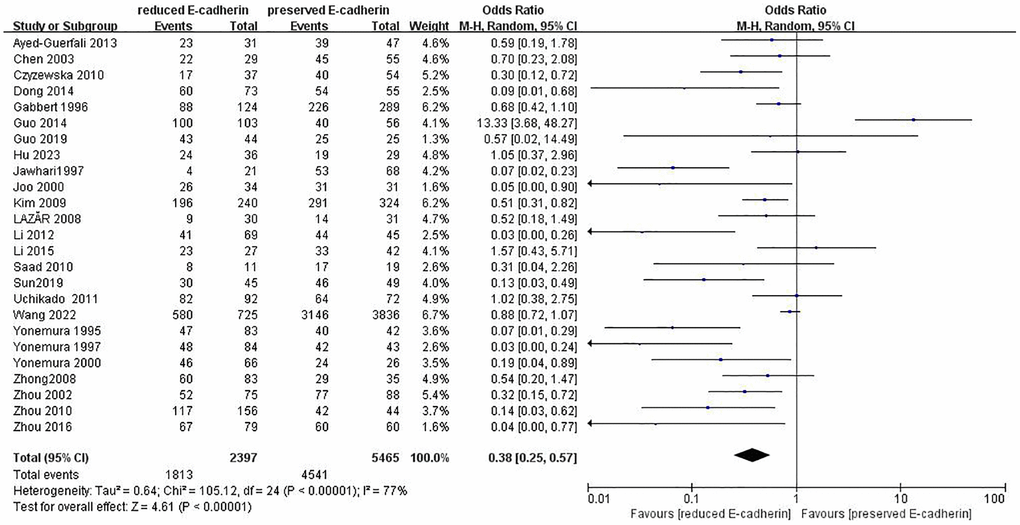
Figure 2. Forest plot of the odds ratio for the correlation of E-cadherin expression with one-year overall survival.
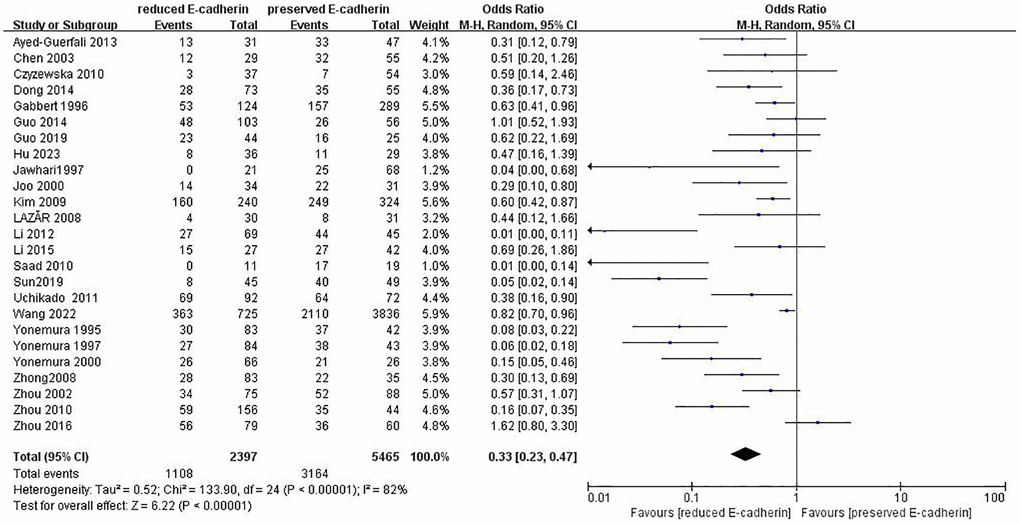
Figure 3. Forest plot of the odds ratio for the correlation of E-cadherin expression with three-year overall survival.
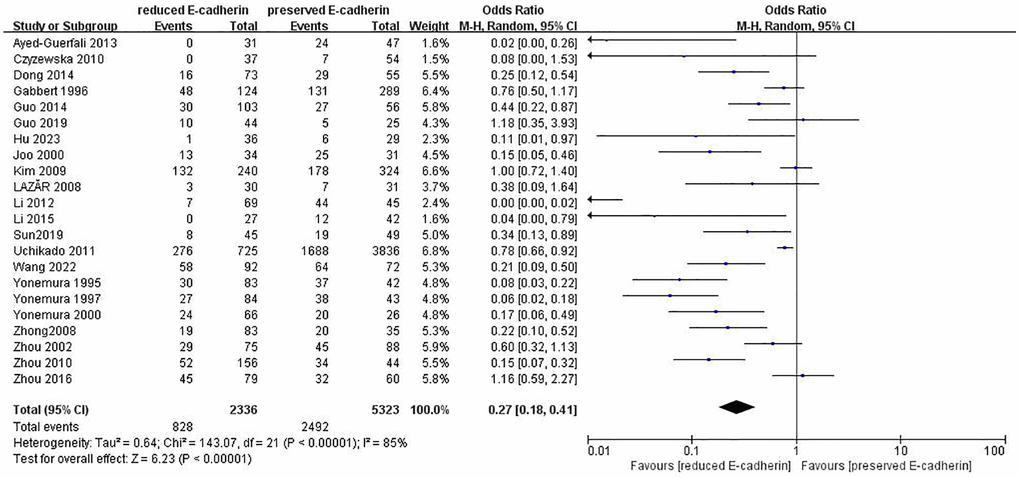
Figure 4. Forest plot of the odds ratio for the correlation of E-cadherin expression with five-year overall survival.
Table 2. Correlation between E-cadherin expression and OS, clinicopathological feature, and risk factors for GC.
| Outcome of interest | Number of studies | Number of tissue samples | OR (95% CI) | Z-value | P-value | I2(%) |
| One-year overall survival | 25 | RE = 2397, PE = 5465 | 0.38 (0.25–0.57) | 4.61 | <0.00001 | 77 |
| Three-year overall survival | 25 | RE = 2397, PE = 5465 | 0.33 (0.23–0.47) | 6.22 | <0.00001 | 82 |
| Five-year overall survival | 22 | RE = 2336, PE = 5323 | 0.27 (0.18–0.41) | 6.23 | <0.00001 | 85 |
| Depth of invasion | 22 | RE = 2155, PE = 5046 | 0.49 (0.36–0.66) | 4.58 | <0.00001 | 65 |
| Lymphatic node metastasis | 32 | RE = 2700, PE = 5536 | 0.49 (0.38–0.64) | 5.38 | <0.00001 | 73 |
| Distant metastasis | 13 | RE = 662, PE = 621 | 2.24 (1.62–3.09) | 4.88 | <0.00001 | 34 |
| Lauren type | 19 | RE = 1139, PE = 1189 | 0.35 (0.21–0.57) | 4.14 | <0.0001 | 84 |
| Differentiation grade | 32 | RE = 2519, PE = 5497 | 0.29 (0.22–0.39) | 8.58 | <0.00001 | 74 |
| TNM stage | 23 | RE = 1984, PE = 5068 | 0.41 (0.28–0.61) | 4.44 | <0.00001 | 79 |
| Lymphatic vessel invasion | 9 | RE = 601, PE = 679 | 1.77 (1.11–2.82) | 2.39 | 0.02 | 62 |
| Vascular invasion | 13 | RE = 829, PE = 850 | 1.55 (1.22–1.96) | 3.58 | 0.0003 | 17 |
| Peritoneal metastasis | 6 | RE = 358, PE = 338 | 2.17 (1.39–3.39) | 3.40 | 0.0007 | 36 |
| Tumor size (≥5 cm vs. <5 cm) | 10 | RE = 729, PE = 488 | 1.73 (1.34–2.23) | 4.19 | <0.0001 | 10 |
| Tumor size (≥6cm vs. <6 cm) | 3 | RE = 270, PE = 141 | 2.29 (1.51–3.49) | 3.87 | 0.0001 | 4 |
| Borrmann classification | 6 | RE = 397, PE = 327 | 0.5 (0.25–0.99) | 1.97 | 0.048 | 56 |
| Liver metastasis | 5 | RE = 320, PE = 246 | 1.21 (0.67–2.18) | 0.62 | 0.53 | 48 |
| Perineural invasion | 3 | RE = 230, PE = 176 | 1.03 (0.46–2.30) | 0.06 | 0.95 | 65 |
| Hp infection | 4 | RE = 244, PE = 222 | 0.65 (0.29–1.46) | 1.04 | 0.3 | 75 |
| Smoking status | 2 | RE = 405, PE = 2022 | 1.1 (0.94–1.28) | 1.14 | 0.25 | 0 |
| Alcohol consumption | 2 | RE = 758, PE = 3897 | 1 (0.85–1.19) | 0.03 | 0.98 | 0 |
| Familial history | 2 | RE = 804, PE = 3896 | 0.93 (0.78–1.12) | 0.74 | 0.46 | 37 |
| Abbreviations: Hp: Helicobacter pylori, RE: reduced E-cadherin expression, PE: preserved E-cadherin expression; OR: odds ratio; CI: confidence interval; TNM stage: depth of tumor invasion, lymphatic node metastasis, distant metastasis stage classification. |
Association between E-cadherin expression and clinical characteristics
The correlations between E-cadherin expression and depth of invasion, differentiation grade, lymphatic node metastasis, distant metastasis, liver metastasis, peritoneal metastasis, TNM stage, perineural invasion, lymphatic vessel invasion, vascular invasion, Lauren type, Borrmann classification and tumor size were examined. 22 studies [12, 13, 16–19, 21–22, 24, 28–30, 35–42, 44, 45] assessed the association between E-cadherin expression and depth of invasion (T1+T2 vs. T3+T4) (OR: 0.49, 95% CI: 0.36–0.66, Z = 4.58, P < 0.00001, Figure 5). 32 studies [11, 12–22, 24–26, 28–33, 36–46] evaluated the correlation between E-cad expression and lymphatic node metastasis (negative vs. positive) (OR: 0.49, 95% CI: 0.38–0.64, Z = 5.38, P < 0.00001, Figure 6). The result of subgroup analysis displayed that reduced E-cad strikingly related to lymphatic node metastasis of patients with GC in China, Korea, Japan and other countries, as depicted in Table 3. 13 studies [13, 15, 17, 24–26, 28–29, 33, 36, 38, 42, 43] measured the correlation of E-cad expression with distant metastasis (Figure 7). The pooled OR was 2.24 (95% CI: 1.62–3.09, Z = 4.88, P < 0.00001). 9 studies [12, 14, 18, 28, 33, 36, 40, 42, 46] surveyed the correlation between E-cadherin expression and lymphatic vessel invasion (positive vs. negative) (OR: 1.77, 95% CI: 1.11–2.82, Z = 2.39, P = 0.02,Figure 8).13 studies [12, 14–15, 18–20, 28, 33, 36, 38, 40, 42, 43] analyzed the association between E-cadherin expression and vascular invasion (positive vs. negative) (OR: 1.55, 95% CI: 1.22–1.96, Z = 3.58, P = 0.0003, Figure 9). 10 studies [13, 18, 21, 24, 26, 33, 39, 43–45] evaluated the correlation of E-cad expression with tumor size (≥5 cm vs. <5 cm) (OR: 1.73, 95% CI: 1.34–2.23, Z = 4.19, P < 0.0001, Figure 10). 3 studies [20, 40, 41] evaluated the correlation between E-cadherin expression and tumor size (≥6 cm vs. <6 cm) (Figure 11). The pooled OR was 2.29 (95% CI: 1.51–3.49, Z = 3.87, P = 0.0001). 23 studies [12, 13, 15, 17–20, 22, 24–26, 28–30, 35–41, 43, 46] appraised the association of E-cadherin expression with TNM stage (I+II vs. III+IV) (OR:0.41,95% CI: 0.28-0.61, Z = 4.44, P < 0.00001, Figure 12). 19 studies [11–13, 15–16, 18, 21, 23–26, 28, 31–32, 34, 36, 44–46] estimated the association of E-cad expression with Lauren type (intestine-type vs. diffuse-type) (OR: 0.35, 95% CI: 0.21–0.57, Z = 4.14, P < 0.0001, Figure 13). 32 studies [12–26, 28–33, 35–46] examined the association between E-cadherin expression and differentiation grade (well or moderate-differentiated vs. poor- differentiated) (OR: 0.29, 95% CI: 0.22–0.39, Z = 8.58, P < 0.00001, Figure 14). 6 studies [19, 33, 38, 41, 42, 44] detected the association of E-cad expression with Borrmann classification (Borrmann I+II vs. Borrmann III+IV) (OR: 0.50, 95% CI: 0.25–0.99, Z = 1.97, P = 0.048, Figure 15). 6 studies [15, 33, 36, 38, 41, 42] investigated the association of E-cad expression and peritoneal metastasis (OR: 2.17, 95% CI: 1.39–3.39, Z = 3.40, P = 0.0007, Figure 16). As shown in Supplementary Figures 1 and 2, There is no significant association of E-cadherin expression with liver metastasis or perineural invasion. Taken together, these results above demonstrate that reduced E-cadherin is predominantly correlated with unfavourable clinicopathological parameters.
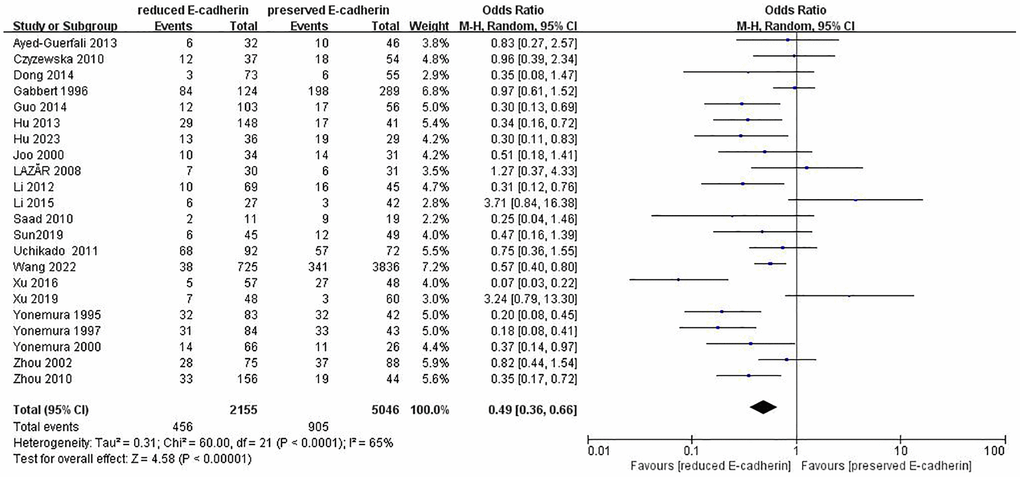
Figure 5. Forest plot of the odds ratio for the correlation of E-cadherin expression with depth of invasion.
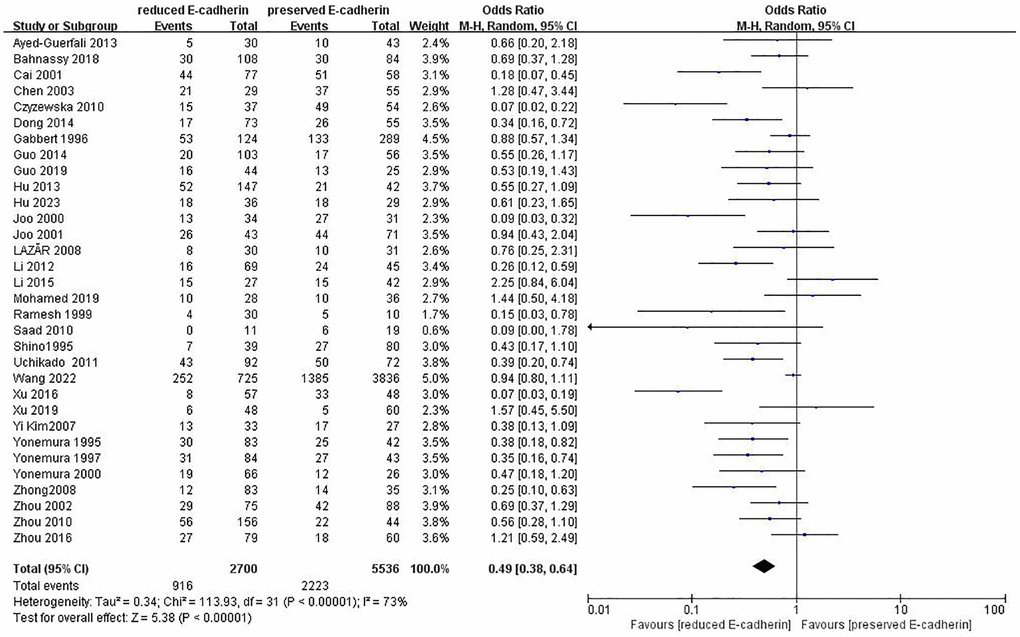
Figure 6. Forest plot of the odds ratio for the correlation of E-cadherin expression with lymphatic node metastasis.
Table 3. Subgroup analysis for E-cadherin expression with OS and lymphatic node metastasis in GC.
| Factors | Subgroup | Number of tissue samples | Number of studies | Z-value | OR (95% CI) | P-value | I2 (%) | P-value (Egger’s test) |
| One-year overall survival |
| China | RE = 1544, PE = 4419 | 11 | 1.92 | 0.51(0.26–1.01) | 0.06 | 77 | 0.235 |
| Japan | RE = 325, PE = 183 | 4 | 2.13 | 0.16 (0.03–0.86) | 0.03 | 82 | 0.200 |
| Korea | RE = 274, PE = 355 | 4 | 1.71 | 0.27 (0.06–1.21) | 0.09 | 77 | 0.059 |
| Other countries | RE = 254, PE = 508 | 6 | 2.98 | 0.36 (0.19–0.71) | 0.02 | 65 | 0.489 |
| Three-year overall survival |
| China | RE = 1544, PE = 4419 | 11 | 3.44 | 0.45 (0.29–0.71) | 0.00006 | 81 | 0.063 |
| Japan | RE = 325, PE = 183 | 4 | 4.65 | 0.13 (0.06–0.31) | <0.00001 | 65 | 0.52 |
| Korea | RE = 274, PE = 355 | 4 | 2.25 | 0.29 (0.10–0.86) | 0.02 | 81 | 0.218 |
| Other countries | RE = 254, PE = 508 | 6 | 2.71 | 0.31 (0.13–0.72) | 0.0007 | 63 | 0.233 |
| Five-year overall survival |
| China | RE = 1515, PE = 4364 | 10 | 3.59 | 0.44 (0.28–0.69) | <0.0001 | 78 | 0.052 |
| Japan | RE = 325, PE = 183 | 4 | 6.92 | 0.12 (0.07–0.22) | <0.0001 | 33 | 0.064 |
| Korea | RE = 274, PE = 355 | 4 | 2.14 | 0.08 (0.01–0.81) | 0.033 | 82 | 0.272 |
| Other countries | RE = 222, PE = 421 | 4 | 1.94 | 0.24 (0.06–1.01) | 0.052 | 69 | 0.079 |
| Lymphatic node metastasis |
| China | RE = 1828, PE = 4578 | 16 | 3.26 | 0.54 (0.38–0.78) | 0.001 | 77 | 0.829 |
| Japan | RE = 364, PE = 263 | 5 | 5.20 | 0.39 (0.28–0.56) | <0.0001 | 0 | 0.627 |
| Korea | RE = 110, PE = 129 | 3 | 2.04 | 0.44 (0.33–0.59) | 0.042 | 30 | 0.92 |
| Other countries | RE = 398, PE = 566 | 8 | 2.20 | 0.49 (0.26–0.93) | 0.028 | 71 | 0.064 |
| Abbreviations: OR: odds ratio; CI: confidence interval. |
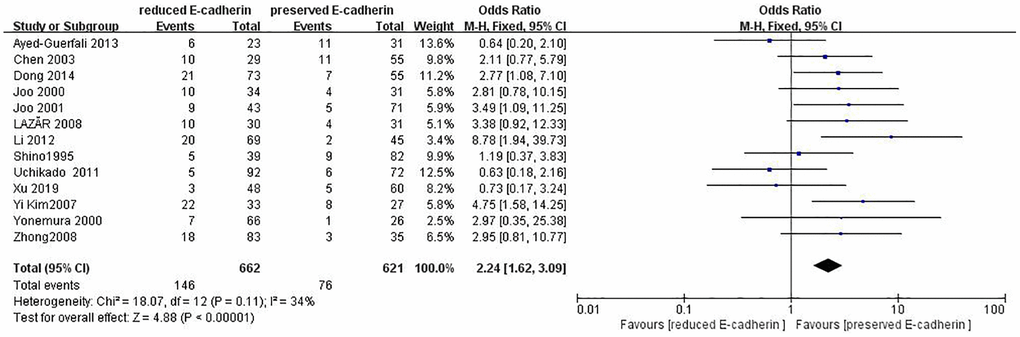
Figure 7. Forest plot of the odds ratio for the correlation of E-cadherin expression with distant metastasis.
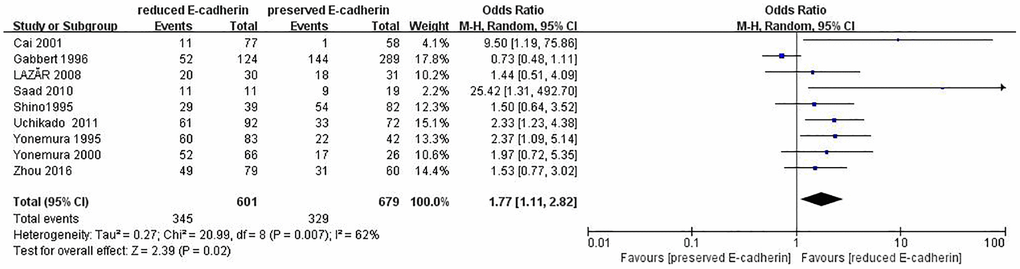
Figure 8. Forest plot of the odds ratio for the correlation of E-cadherin expression with lymphatic vessel invasion.
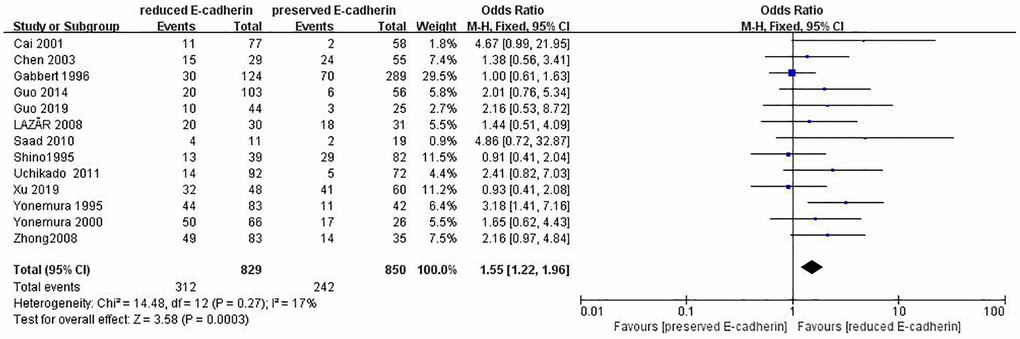
Figure 9. Forest plot of the odds ratio for the correlation of E-cadherin expression with vascular invasion.
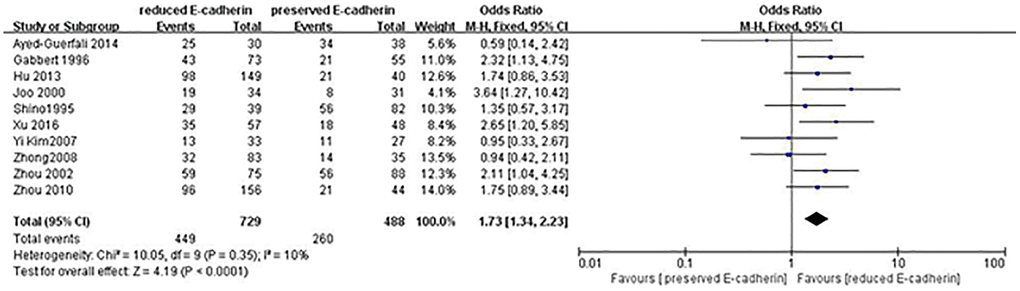
Figure 10. Forest plot of the odds ratio for the correlation of E-cadherin expression with tumor size (≥5 cm vs. <5 cm).
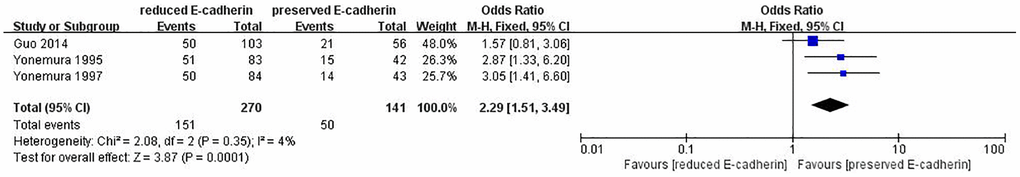
Figure 11. Forest plot of the odds ratio for the correlation of E-cadherin expression with tumor size (≥6 cm vs. <6 cm).
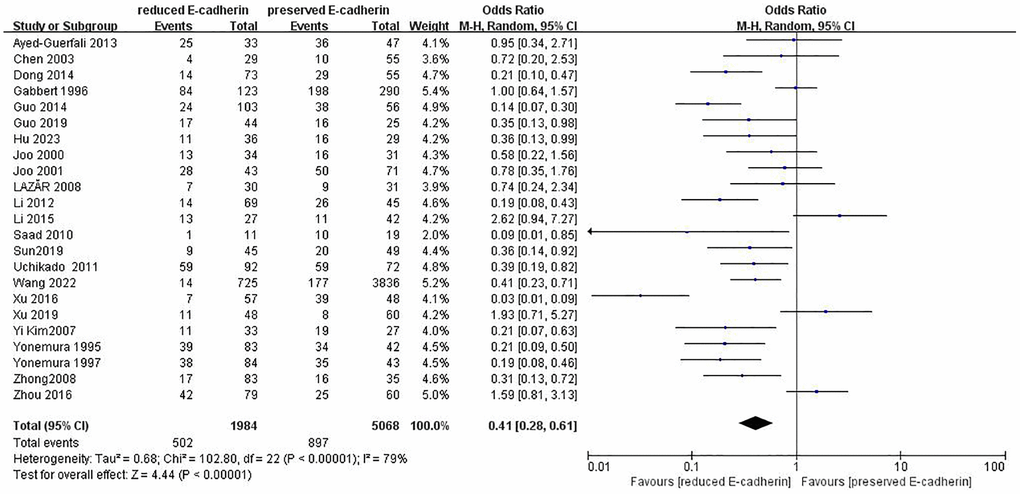
Figure 12. Forest plot of the odds ratio for the correlation of E-cadherin expression with TNM stage.
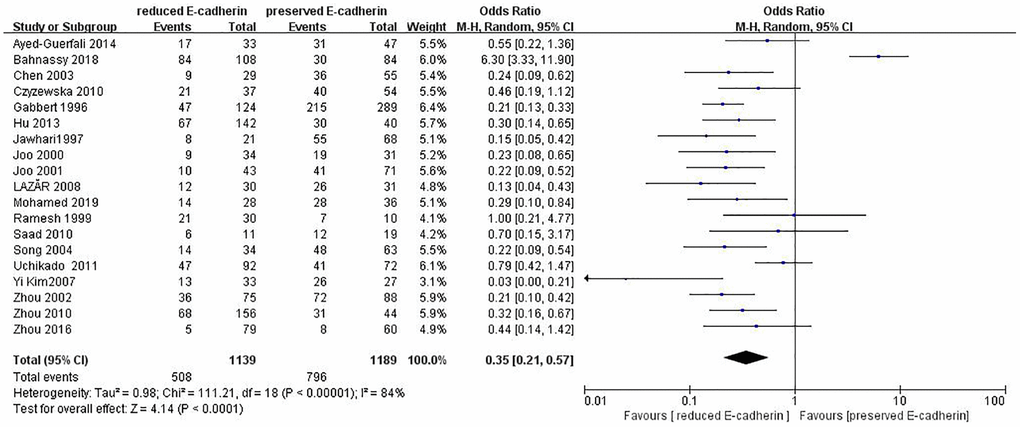
Figure 13. Forest plot of the odds ratio for the correlation of E-cadherin expression with Lauren type.
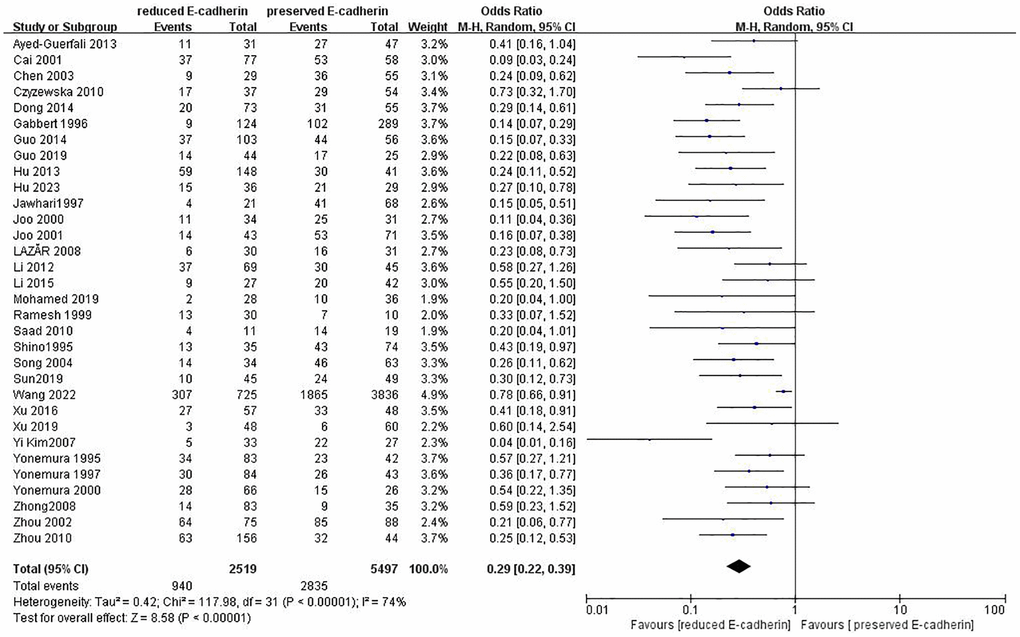
Figure 14. Forest plot of the odds ratio for the correlation of E-cadherin expression with differentiation grade.
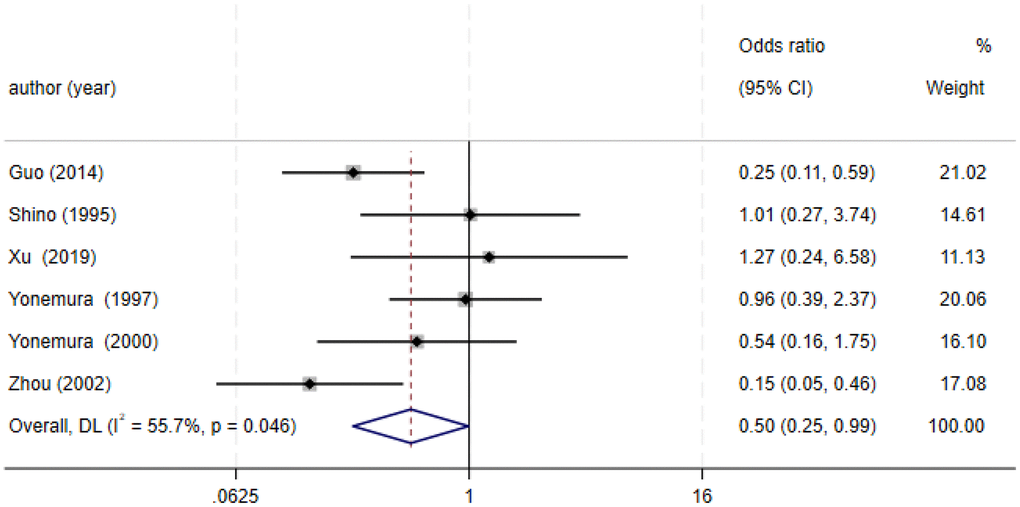
Figure 15. Forest plot of the odds ratio for the correlation of E-cadherin expression with Borrmann classification.
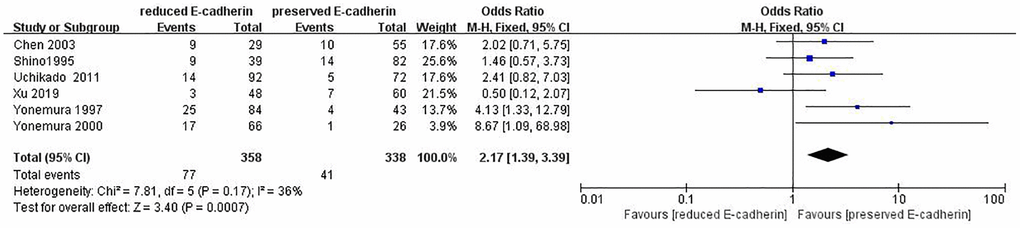
Figure 16. Forest plot of the odds ratio for the correlation of E-cadherin expression with peritoneal metastasis.