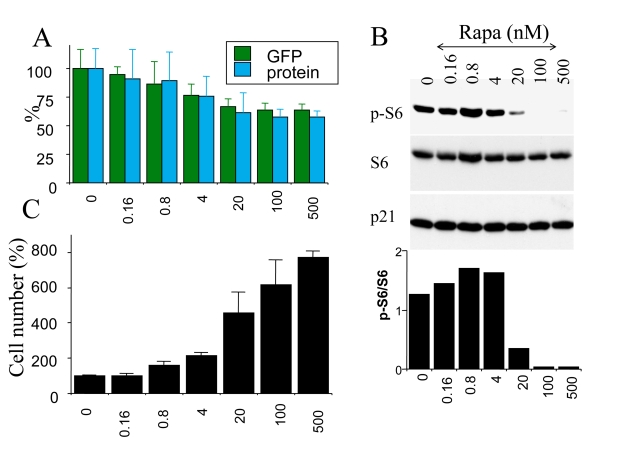
Figure 5.Correlation between S6 phosphorylation, hypertrophy and loss of proliferative potential in senescent cells. HT-p21 cells were plated in 6 well
plates and treated with IPTG plus the increasing concentrations of rapamycin
(from 0.16 to 500 nM). At concentration 0, cells were treated with IPTG alone.
(A) Cellular hypertrophy: protein and GFP. After 3 days, soluble protein and
GFP were measured per well. [Note: in non-proliferating cells, protein/well is a
measure of protein/cells]. Results are shown as percent of IPTG alone (0) without
rapamycin. (B) After 3 days, cells were lysed and immunobloted for p-S6, S6
and p21. (C) PC: preservation of proliferative competence. After 3 days, cells
were washed to remove IPTG and RAPA. Cells were incubated for additional 5 days in the
fresh medium and then were counted. Results are shown as percent of IPTG alone (0)
without rapamycin.