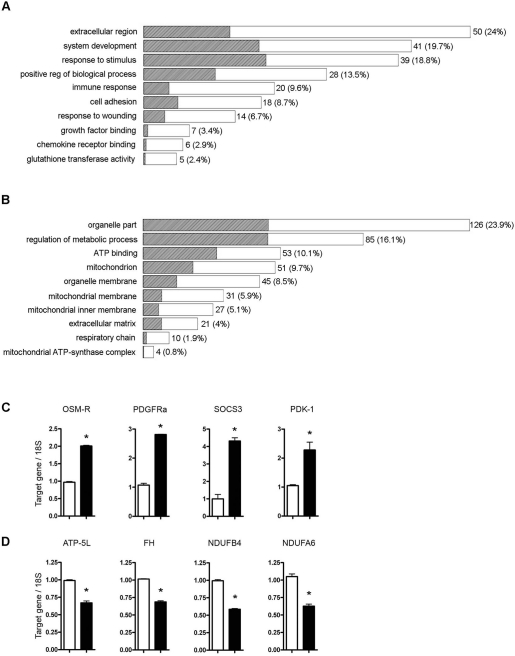
Figure 2.Gene Ontology (GO) analysis on genes differentially expressed in StatWT/WT and Stat3C/C cells. Selected over-represented Gene Ontology functional categories in the lists of genes up- (A) and down-regulated (B) in the Stat3C/C versus the StatWT/WT cells are shown. The statistical significance of the over-representation was evaluated with a one-sided exact Fisher test. The length of each bar is proportional to the number of differentially expressed genes in the functional category, as indicated by the numbers on the right side, and the shaded portion represents the same number as expected by chance. Numbers in brackets represent the percentage of up- or down-regulated genes that are annotated to the functional category. (C) and (D) Validation of some microarray data by Taqman RT-PCR quantification of the indicated RNAs. Data are shown as mean values ± s.e.m. of the indicated genes in cells derived from at least three independent embryos per genotype. (C) OSM-R, oncostatin M receptor; PDGF-Ra, platelet-derived growth factor receptor; SOCS3, Suppressor of Cytokine Signaling-3; PDK-1, pyruvate dehydrogenase kinase-1. (D) ATP-5L, ATP synthase, H+ transporting, mitochondrial F0 complex, subunit G; FH, fumarate hydratase; NDUFB4, NADH dehydrogenase (ubiquinone) 1 beta subcomplex subunit 4; NDUFA6, NADH dehydrogenase (ubiquinone) 1 alpha subcomplex subunit 6. *, p ≤ 0,01. Empty bars or filled bars, Stat3WT/WT or Stat3C/C MEFs.