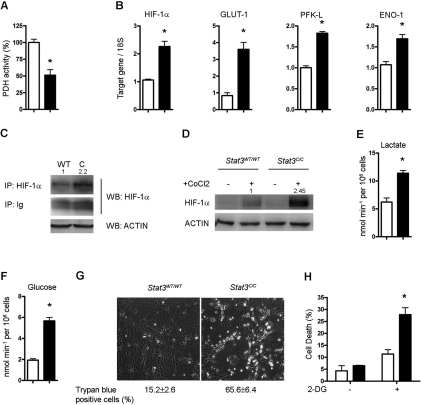
Figure 3.Glycolytic metabolism of Stat3C/C MEFs. The histograms represent mean values ± s.e.m. of three independent experiments. Empty bars or filled bars, Stat3WT/WT or Stat3C/C MEFs respectively. *, p < 0,01. (A) Histograms show the pyruvate dehydrogenase (PDH) activity expressed as percentage of that detected in the Stat3WT/WT MEFs. (B) Taqman RT-PCR quantification of HIF-1α, hypoxia-inducible factor-1α; GLUT-1, glucose transporter-1; PFK-L, phospho-fruktokinase-liver type; ENO-1, enolase-1. (C,D) HIF-1α protein quantification. (C) Immunoprecipitation followed by Western blot of total protein extracts with anti-HIF-1α antibodies. ACTIN was quantified in the total extracts as a loading control. The numbers at the top of the lanes represent the quantification of the HIF-1α-specific signals upon normalization to IgGs. (D) Western blot. Cells were treated or not with Cobalt Chloride (CoCl2) for 4 hours and nuclear protein extracts were stained for HIF-1α and ACTIN as an internal control. The numbers at the top of the lanes represent the quantification of the HIF-1α-specific signals upon normalization to ACTIN. (E) Lactate production was measured in the culture medium as a function of concentration, time and cell number. (F) Glucose intake was calculated as the difference in glucose concentration in the medium before and after cell culturing. (G,H) Increased sensitivity of Stat3C/C MEFs to glucose deprivation. (G) Cells were grown for 48 hours in medium with no glucose and cell viability evaluated by trypan blue staining. Numbers show the percentage ± s.e.m. of trypan blue positive cells. (H) Cells were treated for 48 hours with the glucose analogue 2-DG. Cell death was measured by flow cytometry and represented as the portion of cells in the sub G1/G0 region upon propidium iodide staining.