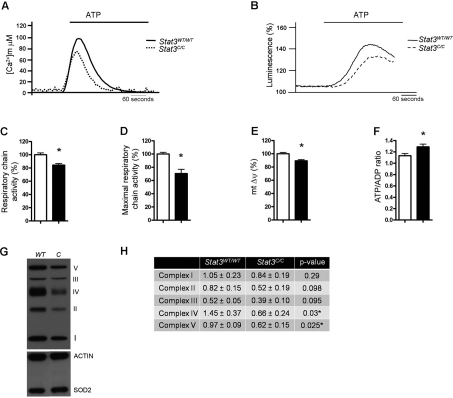
Figure 4.Decreased mitochondrial activity and enhanced ATP/ADP ratio of Stat3C/C MEFs. (A) Mitochondrial Ca2+ homeostasis. MEFs of the indicated genotypes were transduced with a mitochondria-targeted aequorin (AEQ), which was measured then upon challenging with 100 μM ATP as indicated. (B) ATP-induced changes in ATP concentration in mitochondria. MEFs were transiently transfected with a mitochondria-targeted luciferase 36 hours prior to ATP measurement, and data expressed as a percentage of the initial value. (A,B) Data are representative of at least 10 traces, each from 3 independent experiments. (C) Respiratory chain activity measured with resazurine. *, p < 0.01 (n=6). (D) Maximal respiratory chain activity, measured with the use of resazurine in the presence of 300nM FCCP. *, p < 0.01 (n=6). (E) Mitochondrial membrane potential. *, p < 0.05 (n=9). (C-E) Data are mean ± s.e.m., expressed as percentage of the value detected in the Stat3WT/WT MEFs. (F) ATP/ADP ratio was expressed as mean ± s.e.m.of four independent samples per genotype. *, p < 0.05. (C-F) Empty bars or filled bars, Stat3WT/WT or Stat3C/C MEFs respectively. (G) Western blot with antibodies against specific ETC components. CI subunit NDUFB8, complex I; CII-30kD, complex II; CIII-Core protein, complex III; CIV subunit, complex IV; CV alpha subunit, complex V. Actin and SOD2 were used as internal control for total and mitochondrial content. (H) Quantification of the different complexes, shown as mean ± s.e.m. of three independent samples per genotype. P values are shown.