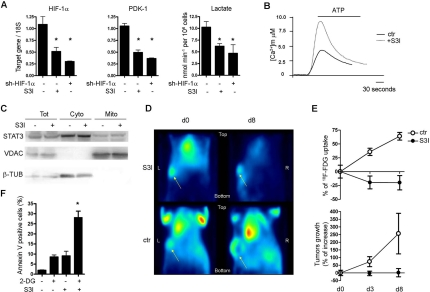
Figure 7.In vitro and in vivo STAT3-dependent glycolytic metabolism in MDA-MB468 human breast tumour cells. (A) Expression of the indicated mRNAs (by Taqman RT-PCR) and lactate production were measured in MDA-MB468 cells, either treated with the S3I STAT3 inhibitor for 12 hours or silenced for HIF-1α, as indicated. Data are shown as mean values ± s.e.m. of three independent experiments. *, p ≤ 0,001. (B) The mitochondrial Ca2+ response was assessed as described in the legend to Figure 4, in cells either treated or not with S3I for 12 hours. (C) STAT3 sub-cellular localization was assessed as described in the legend to Figure 5. (D) Tumour 18F-FDG uptake. Mice were inoculated with MDA-MB468 cells and tumours let grow up to 60 mm3 prior to S3I and 18F-FDG treatment. Images were acquired at the indicated times after the first S3I treatment. Shown are coronal section of tumour of one (out of five) S3I-treated (8 days) and one (out of three) control mice. Yellow arrows indicate the tumours. (E) The upper graph represents the variation of glucose uptake normalized over tumour size at the indicated times after starting S3I treatment. % of 18F-FDG uptake= (Suvd=n - Suvd=0)*100/ Suvd=0. The lower graph represents the mean tumour volume ± s.e.m. at the same times. Note decreased glucose uptake at day 3 (d3) and 8 (d8) upon S3I treatment, compared to constant tumour volume. (F) Co-operativity between glucose deprivation and S3I treatment. Cells were treated for 48 hours with the glucose analogue 2-DG and S3I, either alone or in combination, at sub-optimal concentrations. Data are shown as the percentage ± s.e.m. of Annexin V positive cells. *, p < 0,05 (n=4).
Figure 7 — A STAT3-mediated metabolic switch is involved in tumour transformation and STAT3 addiction | Aging