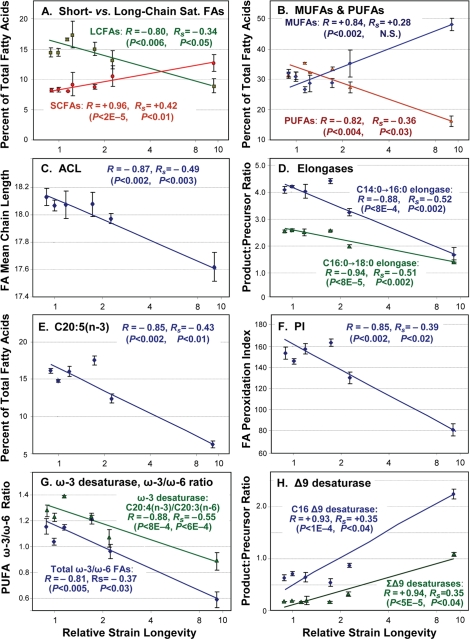
Figure 2.Trends of fatty-acid composition with increasing life span.In each panel, data points with error bars indicate means ± standard errors, of GC-MS quantitations for the indicated lipid component expressed as a percent of total fatty acids quantified for that run. X-axes display median lifespans from Table 1: [strains; number of independent cohorts/runs]: 1.0 [N2DRM, SR803, SR818, SR819, SR820; n = 20], 1.1 - 1.2 [SR800, SR801; n = 4], 1.6 [SR807; n = 5], 2.3 [SR806; n = 3] and 9.6 [SR808; n = 4]. Medians (Table 1) are more robust than means to effects of outliers. Y-axes show (panels A, B and E) the percent of total fatty acids in each indicated class; (C) Average Chain Length; (D) activities of fatty-acid elongases, inferred from FA ratios (C16:0/C14:0, C18:0/C16:0); (F) Peroxidation Index (defined in Table 2 legend); (G) activities of ω-3 desaturases, inferred from FA ratios (e.g., C20:4(n-3)/C20:3(n-6)), and ω-3/ω-6 ratios for all PUFAs; and (H) inferred Δ9 desaturase activities (C16:1Δ9/C16:0, C18:1Δ9/C18:0). In each panel, R denotes the Pearson correlation coefficient, reflecting a linear relationship between the log(10) of strain lifespan and the indicated fatty-acid parameter. RS is the Spearman correlation coefficient, relating the rank-order of strain lifespan to rank-order of fatty-acid parameter per class (e.g., the % of total FAs) in 36 assays. Table 2 lists the corresponding significance thresholds. R values shown here were calculated by treating each of 10 strains as one sample point. This reduces significance (due to lower N), but increases R, relative to points derived from the 36 GC-MS measurements on independent cohorts, due to the lower variance of means.