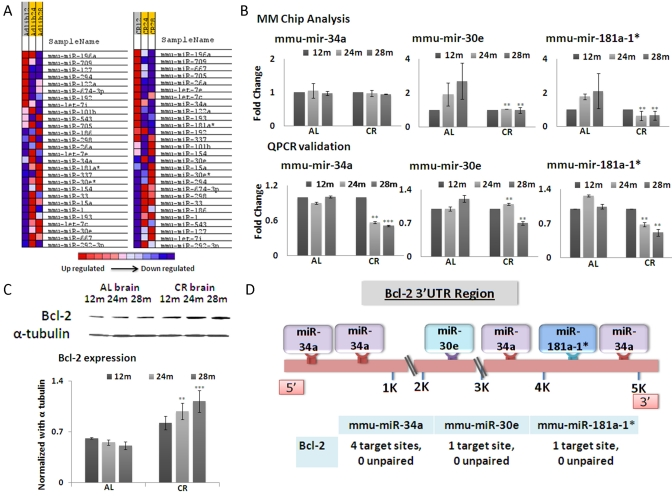
Figure 1.(A) Based on microRNA microarray chip data, a heat map indicating the expression levels of miRNAs with respect to age and mouse diet category (Ad libitum, AL and Calorie restricted, CR) in brain tissues was generated. Intensity of color represents relative expression, with blue representing decreased expression, and red representing increased expression. The comparison is drawn on the basis of expression among the mouse categories. (B) Graphical representation of miRNA (mmu-miR-34a, mmu-miR-30e and mmu-miR-181a-1*) expression in brain tissues, which exhibit the greatest fold changes among 12, 24 and 28 months in CR-fed and Ad lib mice. Samples are represented by age in months (12, 24, or 28). AL and CR for Ad lib and calorie restricted respectively. (C) Western blot analysis of Bcl-2, with alpha-tubulin as normalization control. The histogram shows average densitometry measurements of Bcl-2 after normalization. (D) Schematic diagram showing miRNA binding sites on the 3'UTR region of the Bcl-2 gene. (**p<0.01, **p<0.0001 in panels B and C; all histograms represent average ± std.dev.)