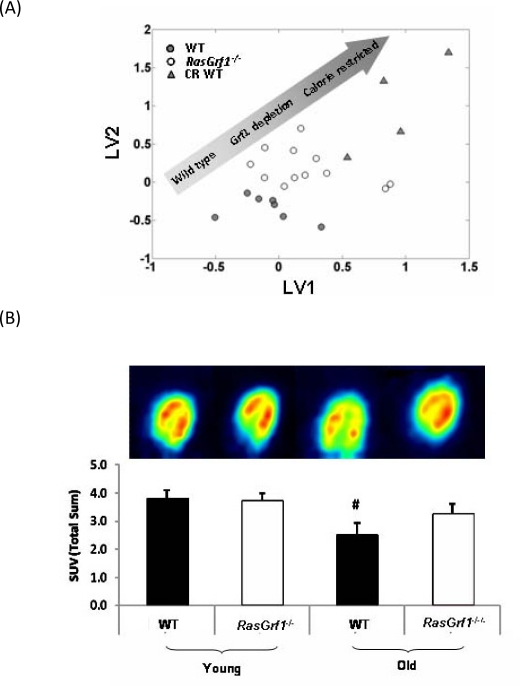
Figure 5.Analysis Of Metabolic Parameters in RasGrf1 Deficient and Control Mice(A) Metabolomic analysis reveals a metabolic shift of RasGrf1−/− fed male mice towards caloric restricted WT (4-6 months old). Multivariate analysis (PLS - DA) of NMR spectra of blood plasma showing global metabolic profiles of WT, RasGrf1−/−, and calorie restricted WT mice. The graph represents the scores plot of the PLS-DA model for discrimination between WT and RasGrf1−/−. The graph also shows the metabolic profile of WT animals on caloric restriction projected over the PLS-DA latent space. Each symbol represents an animal. (B) Glucose up-take in vivo by heart of WT and RasGrf1−/− male mice. Positron emission tomography (PET) analysis was used to estimate in vivo glucose uptake in young (4-6 months old) and old (20-22 months old) animals. The image is the result of a representative experiment. Histograms represent the means of glucose up-take measured in four animals in each group. Wild type n = 7, RasGrf1−/− n = 8; #p<0.01.