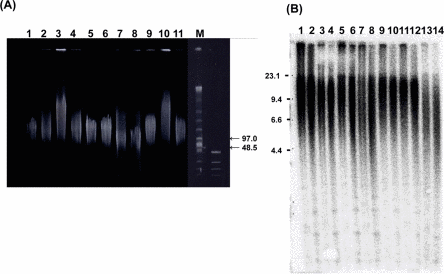
Figure 2.Genofield gel electrophoresis of genomic DNA and Southern blot analysis of samples from WS patients(A) Genofield gel electrophoresis of undigested genomic DNA from the skin and muscle was assessed for DNA quality. Samples were applied to a gel as follows; lane 1: WS-5 skin, lane 2: WS-4(2) skin, lane 3: WS-1 skin, lane 4: WS-7(1) skin, lane 5: WS-2 skin, lane 6: WS-7(2) skin, lane 7: WS-8 skin, lane 8: WS-3 skin, lane 9: WS-1 muscle, lane 10: WS-7(1) muscle, lane 11: WS-2 muscle, respectively. The right lanes (M) show size markers. All 11 DNA samples in this figure exceeded 50 kbp in size. (B) Representative image of Southern blot analysis of 14 DNA samples from the 7 patients. HinfI digests were applied to lanes 1,3,5,7,9,11,13, and RsaI digests were applied to lanes 2, 4, 6, 8, 10, 12,14. Samples were aligned in order of age; lane 1,2: WS-5, lane 3,4: WS-4(1), lane 5,6: WS-1, lane 7,8: WS-7(1), lane 9,10: WS-4 (2), lane 11,12: WS-2, lane 13,14: WS-3, respectively. The median values of TRF length in this experiment were 12.8, 12.0, 11.4, 11.0, 12.1, 11.3, 10.9, 10.2, 12.9, 12.2, 12.7, 12.1, 8.8 and 7.9 kbp, respectively. The left lane shows a size marker. In the WS-4 and WS-7 patients, skin samples were collected twice at different ages (see Table 1). Corresponding relative copy number profiles calculated by the Telometric program are shown as Supplementary data (Figure S1)