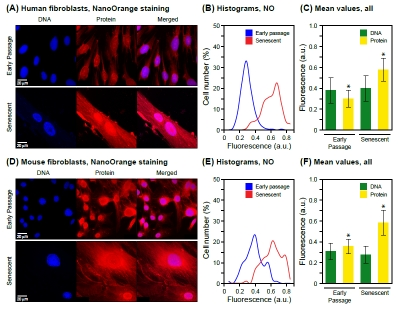
Figure 1.Staining of total protein in intact cells and visualization by fluorescence microscopy.(A) Representative images acquired with cultures of human fibroblasts (HDF). DNA was stained with DAPI (left panels) and protein was stained with NanoOrange (NO, middle panels) as indicated in Methods. Merged images are shown in the right panels. The NanoOrange signal was acquired at 560-620 nm and is shown in the red channel. Early passage cells are shown in the upper panels, and senescent cells in the lower panels. (B) The data for NanoOrange staining (total protein) are displayed as histograms of mean fluorescence intensity (Table 1) in arbitrary units (a.u.) on the X axis, and cell number (% of total) on the Y axis. Fluorescent images were quantified using CellProfiler software as indicated in Methods. A minimum of 1000 cells were scored for each condition (early passage, senescent). (C) Mean values of staining intensity in arbitrary florescence units (a.u.) and their associated standard deviations are shown for both DNA and total protein in early passage as well as senescent cells. The increase in protein signal is statistically significant (* p < 0.001). The signal for DNA does not change between early passage and senescence (p = 0.19). A minimum of 1000 cells were scored for each condition (early passage, senescent) and channel (DNA, blue; protein, red). (D) Representative images acquired with cultures of adult mouse tail fibroblasts (MTF). The panels are arranged and labeled as indicated in (A). (E) Histograms of NanoOrange staining for early passage and senescent MTF cells. The data are displayed as indicated in (B). (F) Mean values of DNA and total protein staining for early passage and senescent MTF cells. The data are displayed as indicated in (C). As with the HDF, the DNA signal did not change significantly (p = 0.12), whereas the increase of the protein signal was significant (* p < 0.001).
Figure 1 — Nuclear protein accumulation in cellular senescence and organismal aging revealed with a novel single-cell resolution fluorescence microscopy assay | Aging