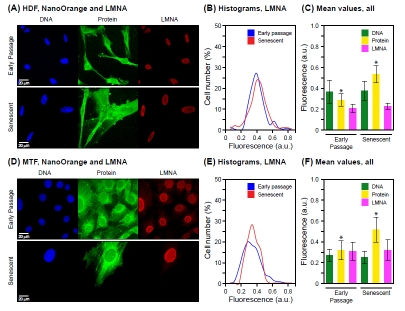
Figure 2.Combination of NanoOrange total protein staining with immunofluorescence microscopyCell we stained with NanoOrange (NO) and subsequently processed for immunofluorescent detection of lamin A/C (LMNA) as indicated in Methods. (A) Representative images acquired with cultures of HDF. DNA (DAPI), total protein (NanoOrange) and LMNA (immunofluorescence) are shown in the left, middle and right panels, respectively. Note that in this figure the NanoOrange signal (acquired at 560-620 nm) is shown pseudo-colored in green, and the LMNA signal (acquired at 665 nm and above using an Alexa 647 secondary antibody) is shown in the red channel. Early passage cells are shown in the upper panels, and senescent cells in the lower panels. (B) Histograms of LMNA staining for early passage and senescent HDF cells. The data are displayed as indicated in Figure 1B. (C) Mean values of staining intensity for DNA, total protein and LMNA in early passage and senescent HDF cells. The data are displayed as indicated in Figure 1C. The increase in protein signal is statistically significant (* p < 0.001). The signal for either DNA (p = 0.16) or LMNA (p = 0.22) does not change significantly between early passage and senescence. (D) Representative images acquired with cultures of MTF. The panels are arranged and labeled as indicated in (A) above. (E) Histograms of LMNA staining for early passage and senescent MTF cells. The data are displayed as indicated in (B) above. (F) Mean values of staining intensity for DNA, total protein and LMNA in early passage and senescent MTF cells. The data are displayed as indicated in (C) above. As with the HDF, the DNA or LMNA signals did not change significantly (p = 0.14 and p = 0.13, respectively), whereas the increase of the protein signal was significant (* p < 0.001).