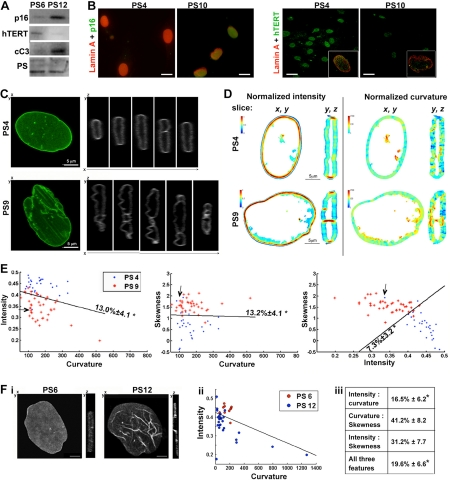
Figure 1.Quantification of nuclear lamina structure changes in senescent cells(A) Western blot analysis of protein extracts from hMSCs at passage 6 and 12 (PS6; PS12). p16INK4a (p16) and hTERT marks senescent cells. The cleaved-caspase-3 (cC3) marks apoptotsis. Equal loading control is shown with total proteins staining with PonceauS (PS). (B) Maximum projections of confocal images of immunofluorescence of p16INK4a (shown in green; upper row) or hTERT (shown in green; lower row) and lamin A (shown in red) in cultures at passage 4 and passage 10. The box insert shows a single nuclei that was co-stained for hTERT (green) and lamin A (red) is. Scale bars are 10 μm for images with INK4a(p16), and 20 μm for images with hTERT. (C) Confocal images of hMSCs expressing WT-lamin A-GFP at passage 4 (PS4), or passage 9 (PS9). Z-stacks were recorded for living cells and 3D-reconstructions were generated. Shown are (x,y)-plane maximum projection and serial (y,z)-slices along the x-axis. Scale bar is 5 μm. (D) Projections of intensity and curvature values in (x, y) and (y, z) slice of a typical cell at passage 4 or 9 (PS4, PS9). Left panel shows the intensity, the values are on a linear scale. Right panel shows the curvature, the values are on a logarithmic scale. For each panel images a (x,y) and a (x,z) plane are shown. (E) Classification of living cells expressing lamin A-GFP at passage 4 (PS4) and passage 9 (PS9). Scatter plots show the distribution of intensity, curvature and skewness in individual cells. A linear classifier is plotted. The classification error and its standard deviation are indicated. An asterisk indicates significant classifications. N4 = 28, N9 = 40 cells. (F) Cell classification between hMSCs at passage 6 and 12 where endogenous lamin A was detected with immunofluorescence. (i) Confocal images of representative nuclei at passage 6 or 12 (ii) Scatter plots show the distribution of intensity and curvature in individual cells. A linear classifier is plotted. (iii) Table shows cross-validations of the classification error ± standard deviation for every two-feature combination and for a test including all three features. Asterisk indicates significant classification. N6 = 12, N12 = 25, p < 0.01