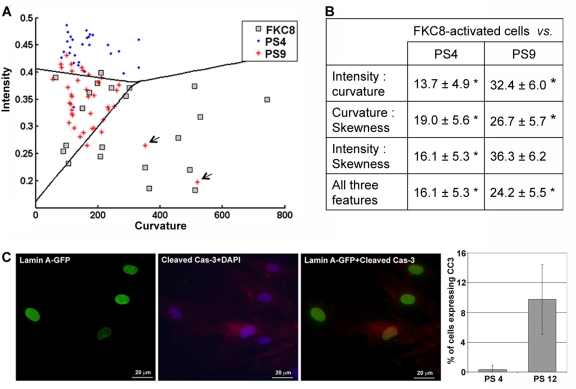
Figure 3.A three-cell population classification assay indicates activation of apoptosis during senescence(A) Cell classification between hMSC populations expressing lamin A-GFP at passage 4 (PS4), passage 9 (PS9), and caspase-8-activated cells (FKC8). The scatter plot shows the distribution of intensity and curvature in individual cells at passage 4 (PS4; blue dot) passage 9 (PS9; red cross) or FKC8-activated cells (FKC8; gray square). A linear classification between the three cell populations is indicated. Arrows indicate outliers at passage 9 that have lamina values comparable to apoptotic cells. Cell number per population: NPS4 = 28, NPS9 = 40 and NFKC8 = 25. (B) Cross validations of the classification error ± standard deviation are summarized in the table for every feature combination. Asterisk indicates significant classification, p < 0.01. (C) Immunolabeling of hMSCs at passage 12with anti-lamin A (green) and anti-cleaved caspase-3 (red) antibodies. Nuclei are counterstained with DAPI. Histograms show the percentage of cells expressing the cleaved-caspase-3 at passage 4 and passage 12. The average and standard deviation over 50 cells is given in the bar plot.