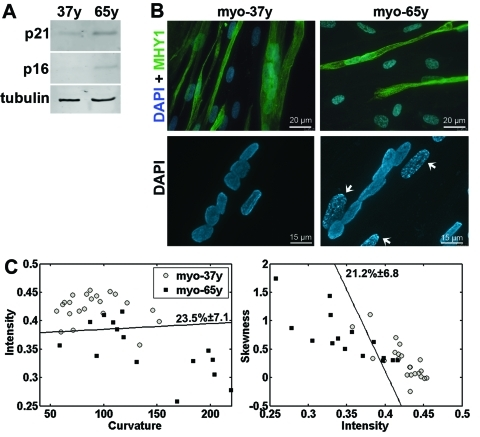
Figure 4.Cell classification in myoblasts from young and old donors(A) Western blot analysis of protein extracts from myoblast cultures from donors at 37 and 65 years (37y and 65y) with antibodies to p21CDKN1A and p16INK4a. Equal loading control is shown with tubulin. (B) Immunohistochemistry with anti-MHY1 antibody in 37y and 65y myotube cultures. Nuclei are counterstained with DAPI. Scale bar is 20 μm. Higher magnification images of DAPI staining show heterochromatic foci (indicated with arrows) in 65y but not in 37y cells. Scale bar is 15 μm. (C) 2D scatter plots show the distribution of intensity, curvature, and skewness in individual cells. A linear classifier is plotted. Cross validation of the classification error ± standard deviation are indicated next to the classifier. Both classifications are significant (p < 0.01). N37y = 22, N65y = 15 cells.