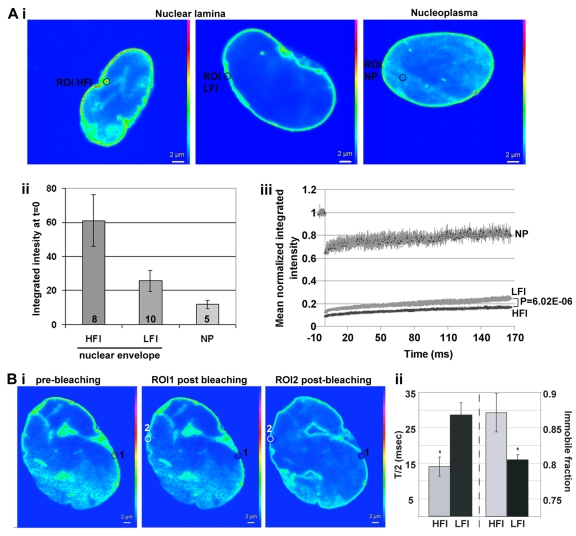
Figure 5.The mobility of lamin A-GFP at the nuclear lamina correlates with protein accumulationFRAP analysis of lamin A-GFP in hMSCs at passage 10. Recovery of fluorescence after photobleaching was performed in selected regions of interest (ROI) with high or low fluorescence intensity (HFI or LFI, respectively). A) shows analysis between cells and B) within cells. FRAP of lamin A-GFP at the nucleoplasm (NP) was used as a control. (A) (i) Single confocal sections of representative cells, ROI is indicated with a circle. Scale bar is 2 μm. (ii) Histogram shows the mean integrated intensity in ROI of HFI, LFI or NP prior to bleaching. Number of cells are indicated inside each bar. (iii) Plot shows recovery of lamin A-GFP fluorescence in ROI of HFI, LFI or NP. Averages and SD represent N cells as indicated in (ii). A statistical significant difference of lamin A-GFP mobility between regions with HFI or LFI is demonstrated with P-value < 0.001. (B) (i) Single confocal sections of a representative cell (left) before bleaching, (middle) after bleaching of ROI 1 (HFI; indicated with a black circle), and (right) after bleaching of ROI 2 (HFI; indicated with a white circle). Scale bar is 2 μm. (ii) Histogram shows the mean of T/2 and the immobile fraction which was calculated from regions with HFI or LFI. Averages and SD represent 5 cells. Significant difference (P < 0.001) T/2 and immobile between HFI and LFI is indicated with an asterisk.