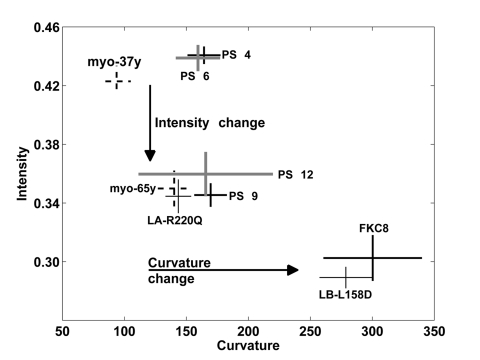
Figure 6.A trend in change of the nuclear lamina between cell populationsPlot shows the distribution of the average and standard deviations of the curvature and intensity of the nuclear lamina for hMSCs and myoblasts cell populations. The cell populations at early passage number and myoblasts from a 37 year-old donor (37y) are distinquished from populations of senescent cells, cells expressing lamin A mutant and and myoblasts from a 65 year-old donor (65y), based on average normalized intensity. These cell populations are also separately clustered apoptotic cells based on average curvature.