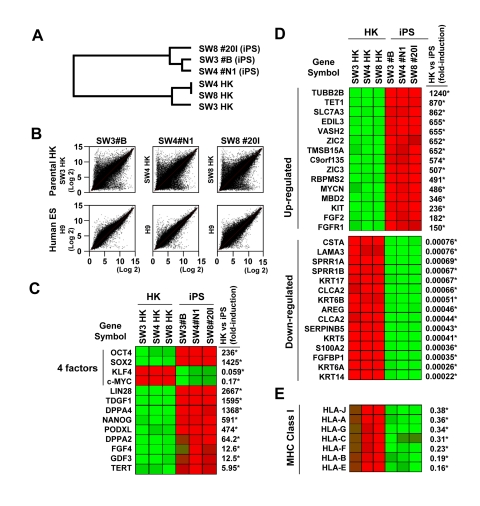
Figure 3.Variations in gene expression profile upon induced pluripotency(A) Dendrogram describing the unsupervised hierarchal clustering of patient-derived HK cells and HK-derived iPS cells. (B) Global gene expression patterns of HK-derived iPS clones were compared with their parental HK cells (upper panels), or with that of human embryonic stem cells (H9, lower panels, GSM190779), upon RNA microarray analysis. (C) Heatmap showing the up-regulation (red) and down-regulation (green) of pluripotency-associated genes in HK- and HK-derived iPS clones. The four factors used to induce pluripotency are indicated. The changes in gene expression levels in iPS cells, relative to those in parental HK cells, were calculated using microarray data from three parental HK cells and three HK-derived iPS cells, and shown as fold-induction in iPS cells. Statistically significant changes are indicated by asterisks (p<0.05). Notably, HK cells originally expressed high levels of endogenous KLF4 and c-MYC, resulting in down-regulation of these two key reprogramming factors in derived iPS cells. (D) Heatmap showing the top 15 genes which were up-regulated (upper panel) or down-regulated (lower panel) upon reprogramming. Statistically significant changes are indicated by asterisks (p<0.05). (E) Comparison of the major histocompatibility complex (MHC) class I gene expression profiles between HK and iPS cells. Statistically significant changes are indicated by asterisks (p<0.05).