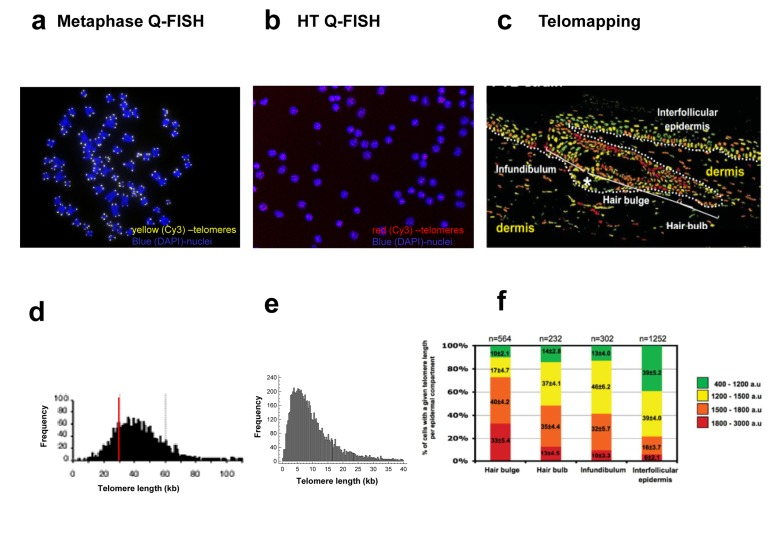
Figure 5.Comparison of the images obtained (a-c) and the output of the data analysis process (d-f) of the different variants of Quantitative FISH methods(a) A metaphase image obtained by the regular Q-FISH on metaphases. Telomeres are stained with Cy3 (yellow) and chromosomes are stained with DAPI (blue). Images are acquired with a regular fluorescent microscope (100X augmentation). (b) PBMC interphase nuclei image obtained by HT Q-FISH method. Telomeres are stained with Cy3 (red) and chromosomes are stained with DAPI (blue). Images are acquired with an automated HT confocal microscope (40X augmentation). (c) Telomere length pseudo-color images obtained by Telomapping of a skin section. Nuclei are colored according to their average telomere fluorescence in arbitrary units (a.u.), from shorter to longer green, yellow, orange and red. Images are acquired with a confocal microscope (20X augmentation). (d) Frequency histogram of individual telomeres (kb). 20-30 metaphases per sample are usually analyzed. (e) Frequency histogram of individual telomere spots. 100-800 interphases per sample are usually analyzed. (f) Telomere length frequency histograms for cells located in the different regions of interest, in this case, in the indicated skin compartments. The number of nuclei analyzed is the corresponding to each region of interest.