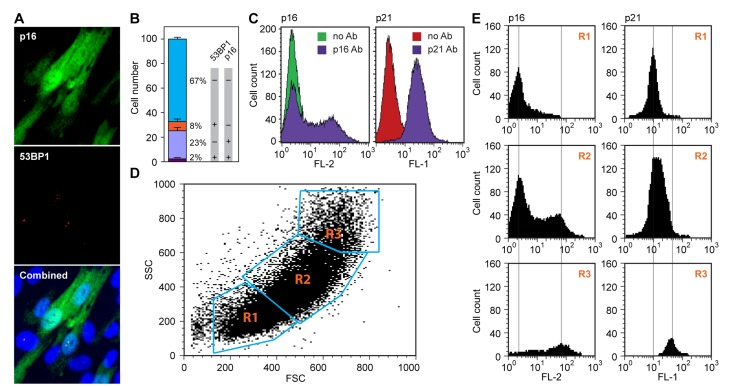
Figure 2.Spontaneous upregulation of the p16-pRb and p53-p21 pathways in hTERT-immortalized HDF(A) p16 and 53BP1 proteins were simultaneously visualized in exponentially cycling cultures by in situ immunofluorescence staining with antibodies to p16 (top panel, green) and 53BP1 (middle panel, red). Note that p16 shows a diffuse cytoplasmic and a nuclear signal, while 53BP1 stains discrete foci in the nucleus. A merged image including DAPI staining is shown in the bottom panel. (B) Quantification of the experiment shown in panel (a). Cells were scored in images of random fields and assigned to one of four categories: double-negative (67%), double-positive (2%), p16 positive only (23%) and 53BP1 positive only (8%). Note the virtual absence of double-positive cells. (C) Flow cytometric analysis of cells stained either with a p16 antibody (left panel), or a p21 antibody (right panel). Samples were processed as indicated in Methods. Samples processed without primary antibody were used as negative controls (no Ab). Secondary antibodies were conjugated with Cy3 (p16, left) and Alexa488 (p21, right), and the data were acquired in the FL-2 and FL-1 channels, respectively. (D, E) Flow cytometric analysis of cells doubly stained with antibodies to p16 and p21. (D) Acquired data were first displayed as a scatter plot of forward scatter (FSC) and side scatter (SSC) parameters, and gates (R1, R2, R3) were drawn around areas of increasing scatter. (E) Cells in the gated areas were then analyzed for fluorescence in the FL-1 (p21) and FL-2 (p16) channels, and the data were displayed as histograms. Note that the smallest cells (R1 gate) displayed essentially no p16 staining and low p21 staining, and the largest cells (R3 gate) displayed the highest levels of both p16 and p21 staining.