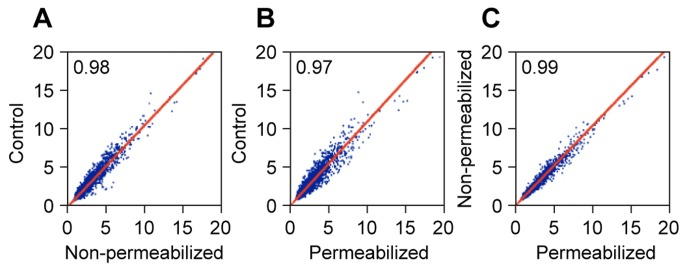
Figure 4.Affymetrix microarray performance of RNA extracted from formaldehyde crosslinked cellsRNA was prepared as in Figure 3A and used for expression profiling on Affymetrix Human Gene ST 1.0 arrays. The experiment included both permeabilized and non-permeabilized samples, and RNA that was prepared directly from cells using Trizol reagent as a control. Correlation plots of the expression values (log2 PLIER scores) are shown for 33,297 probesets. Genes with very low expression scores (lowest quartile of all probesets) were excluded from the analysis. (A) Control versus Non-permeabilized. (B) Control versus Permeabilized. (C) Non-permeabilized versus Permeabilized.
Figure 4 — How to measure RNA expression in rare senescent cells expressing any specific protein such as p16Ink4a | Aging