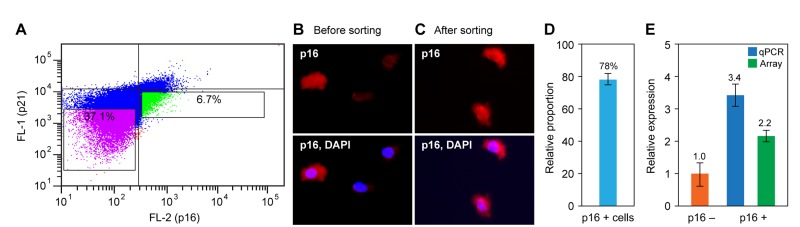
Figure 5.Preparative flow sorting of p16-positive cells and analysis of the recovered RNA(A) Cells were doubly stained with p16 and p21 antibodies and processed as described in the Methods. Data from an actual sorting experiment are shown. The gates were set using singly stained and unstained preparations (not shown). The indicated regions were collected: green, p16-positive and p21-negative cells; purple, double negative cells. (B, C) After the sort the collected samples were spotted on glass slides and examined by fluorescence microscopy to determine the degree of enrichment. Representative images of (b) the total population and (c) the green-gated region from panel (a) are shown. (D) Quantification of p16-positive cells from panel (c). The unsorted population contained 18% of 16-positive cells (not shown). (E) RNA was prepared from flow sorted p16-positive and p16-negative cells (green and purple gated regions in panel (a), respectively), and p16 expression was assessed by qPCR and microarray analysis. Data are shown as fold change relative to p16-negative cells, and were normalized to GAPDH expression.