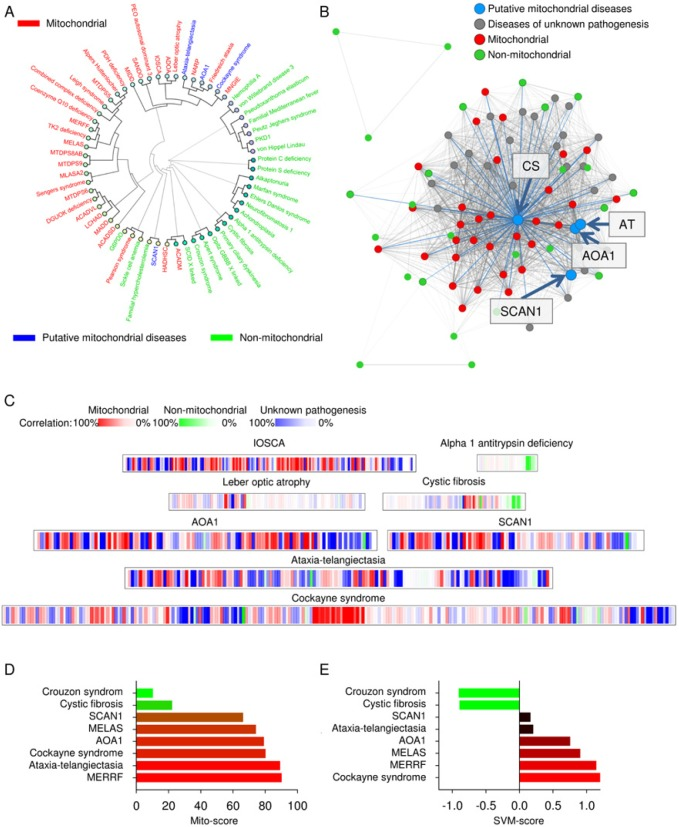
Figure 2.Putative mitochondrial diseases are identified using www.mitodb.com(A) The clustering of several diseases of unknown pathogenesis with recently recognized mitochondrial dysfunction (blue) and mitochondrial (red) and non-mitochondrial diseases (green). AOA1: Ataxia with oculomotor apraxia 1; SCAN1: Spinocerebellar ataxia with axonal neuropathy 1. (B) A representation of how the putative mitochondrial diseases (blue) associate within the disease network. Each dot represents a disease and the closer two diseases are connected the shorter the distance between them. Mitochondrial diseases: red; non-mitochondrial diseases: green. (C) The mitochondrial barcode of a number of diseases. Each bar represents a clinical parameter that is shared with another disease in the database. Red is mitochondrial diseases, green is non-mitochondrial and blue is diseases of unknown pathogenesis. The tint is given by the percentage of patients that are affected in the disease tested multiplied by the percentage of patients that are affected in the disease in the database that shares the parameter. IOSCA: infantile onset spinocerebellar ataxia (D) The mito score of the putative mitochondrial diseases and two bona fide mitochondrial (MERFF and MELAS) and two non-mitochondrial (cystic fibrosis and Crouzon syndrome) diseases. (E) The SVM score of the tested diseases and two mitochondrial (MERFF and MELAS) and two non-mitochondrial (cystic fibrosis and Crouzon syndrome) diseases.