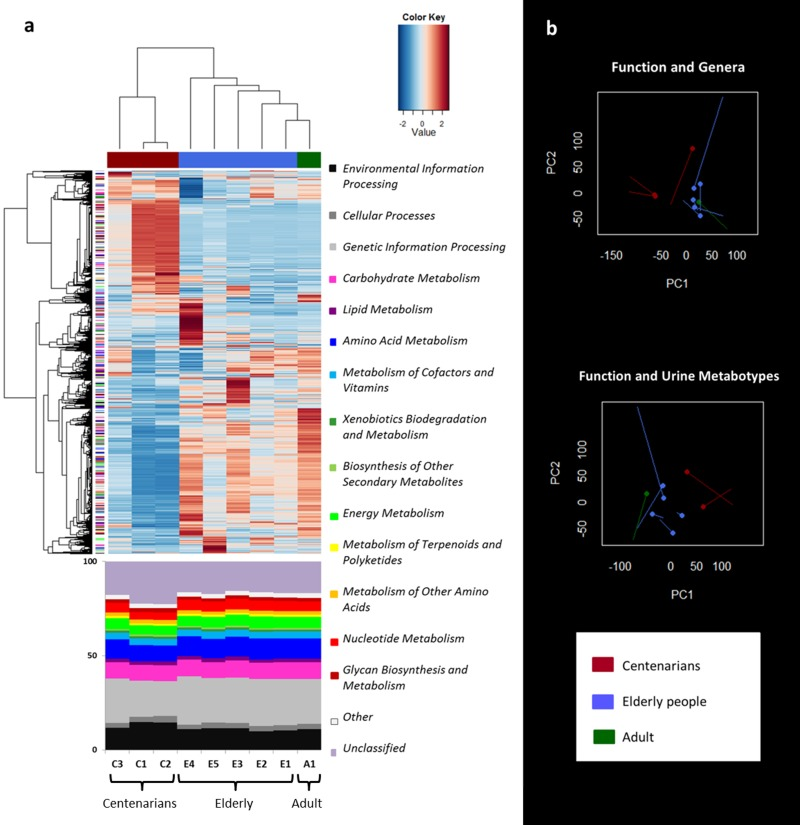
Figure 3.Metagenome function analysis separates centenarians from the other subjects in agreement with genus and urine metabolite clusteringa, Hierarchical Ward-linkage clustering based on the Pearson correlation coefficients of the abundance of KO genes, filtered for KO gene subject presence ≥ 1 in at least 8/9 subjects. KO genes are clustered in the vertical tree and color-coded according to the first level of KEGG classification or the second level for functions concerning metabolism. 2719 KO genes confidently classified in the KEGG database are visualized. The bottom panel shows the relative abundance of the KEGG categories. b, Procrustes analysis combining Euclidean PCoA of functional microbiota (non-circle end of lines) with either Euclidean PCoA based on the genus dataset (circle-end of lines; upper graph) [8], or Euclidean PCoA based on the spectra of urine metabolites (circle-end of lines; lower graph) [22]. In both graphs color codes are per age group as in Figure 1.
Figure 3 — Functional metagenomic profiling of intestinal microbiome in extreme ageing | Aging