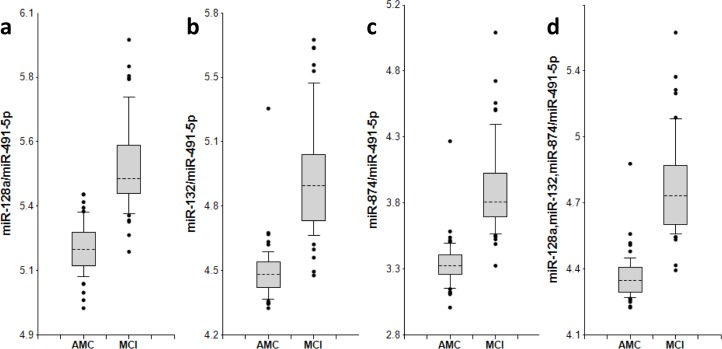
Figure 1.miR-132 family biomarker pairs in plasma of AMC and MCI subjectsThe concentrations of miRNA in plasma samples of MCI and age-matched donors with normal cognitive function, 50 samples in each group, were measured by RT-PCR and the ratios of various miRNA were calculated as 2−ΔCt × 100. Here and in other figures with box and whisker plots the results are presented in the Log10 scale. The upper and lower limits of the boxes and the lines inside the boxes indicate the 75th and 25th percentiles and the median, respectively. The upper and lower horizontal bars denote the 90th and 10th percentiles, respectively. The points indicate assay values located outside of 80% data. AMC: age-matches controls; MCI: MCI patients.